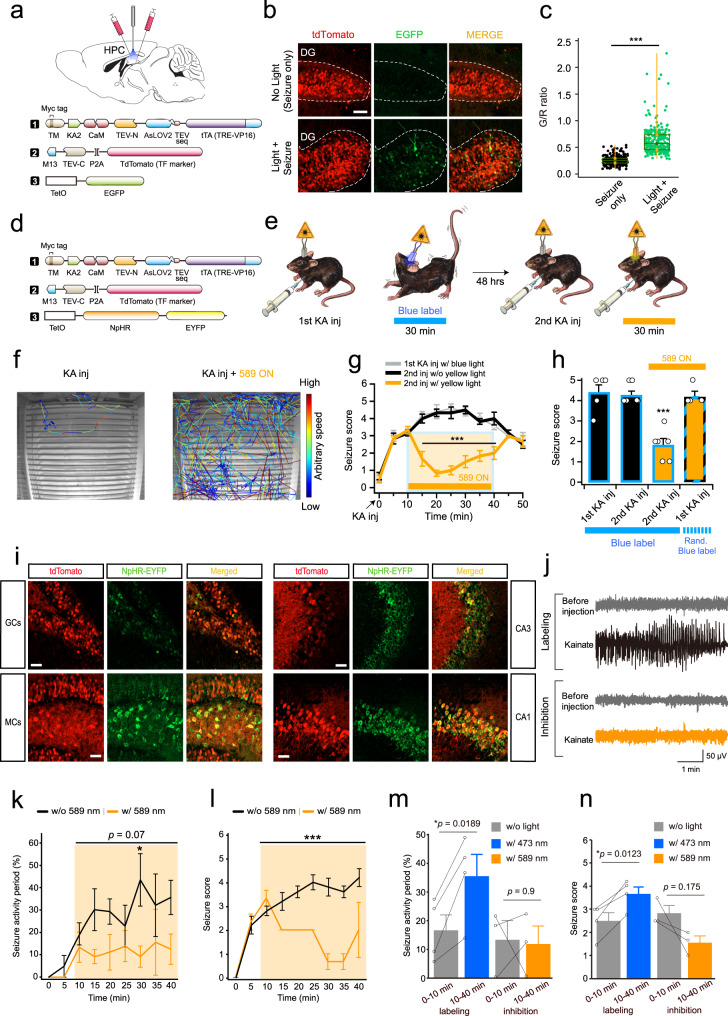
Fig. 4. Amelioration of epileptic seizure by ST-Cal-Light.
a Schematic drawing of virus injection and fiber optic implantation. ST-Cal-Light viruses with TetO-EGFP reporter were injected into both hippocampal CA1 and CA3 areas bilaterally. b Representative images of tdTomato (transfection marker) and EGFP reporter gene expression. When seizure was induced by KA administration, little gene expression was created in the absence of light, demonstrating cell labeling was dependent on blue light. Scale bars, 50 μm. c A box-and-whisker plot of G/R ratio. Each circle indicates the cell (Seizure only: 0.258 ± 0.005 from 252 cells; light + seizure: 0.629 ± 0.017 from 252 cells, P = 6.71 × 10−72). The top and bottom of the box indicate the 25th and 75th percentile, respectively, the horizontal line across the box presents the median, and the whiskers mean the minimum and maximum values. Asterisks (***P < 0.005) indicate a two-tailed unpaired t-test. d For inhibition experiments, a TetO-NpHR reporter was used. The same ST-Cal-Light viruses were injected, as shown in (a). e A cartoon demonstrating experiment procedures. A seizure was induced by KA injection, and blue light was illuminated for labeling. Two days later, KA was injected again for the second seizure induction and compared the severity of the seizure with or without 589 nm light. f Sample movement traces after KA injection with or without yellow light. Movement during the same period of time was plotted. Different colors represent animal movement speed. ezTrack analysis was used for tracing (from Denise Cai’s lab)44. g Time-lapse changes of seizure score after KA administration. h Average seizure scores at various conditions. The random blue label condition was 5 s of blue light 3 times at the 1 min interval during the fear conditioning. i Hippocampal granule cells (GCs), mossy cells (MCs), CA1 and CA3 neurons were labeled by ST-Cal-Light, indicating increased neuronal activity in broad hippocampal areas. Scale bars, 50 μm. j Representative traces of normal and ictal-like activity before and after KA injection. k Time course of seizure activity progression after KA injection. The data of the time course are shown as mean values ± SEM. l Average changes in seizure score over time. m, n Comparison of seizure activity period between the first 10 min and the rest of 30 min. Source data and statistics are provided in the Source Data file.

