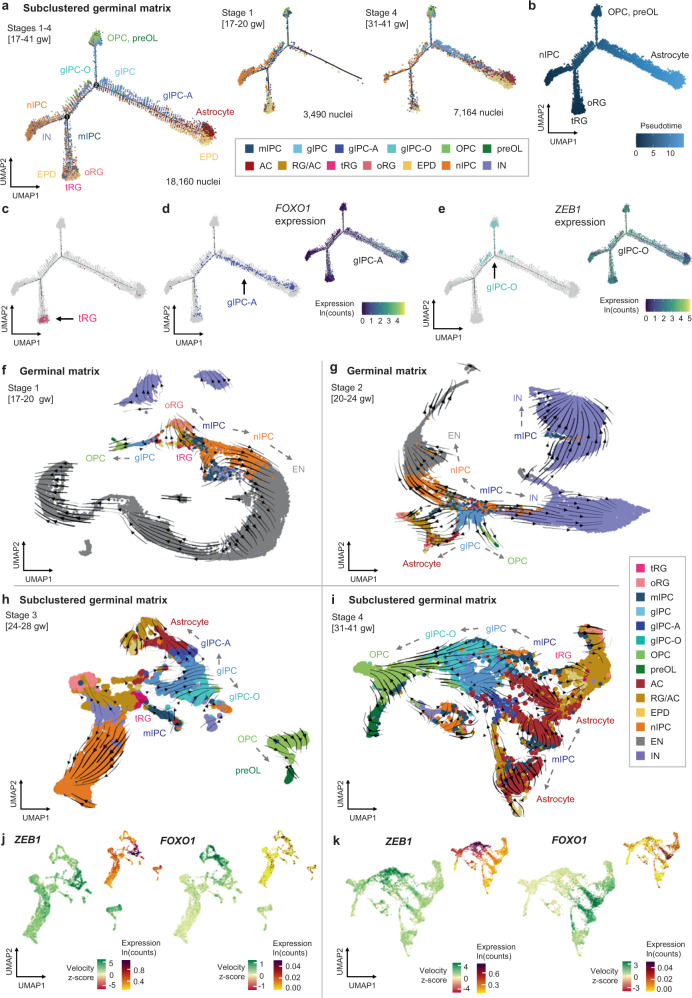
Fig. 5. Reconstruction of cell type lineages in the germinal matrix.
a–e Trajectory reconstruction of GM lineages (subclustered cell type annotations) using Monocle2, showing the distribution of different cell subsets (a, c–e) and inferred pseudotime (b). tRGs were selected as the root population. Average log-normalized gene expression of the gIPC-A marker FOXO1 (d, right), and the gIPC-O marker ZEB1 (e, right) are also shown. f–i Directionality analysis of GM cell types. Velocity vectors (solid arrows) calculated for GM Stages 1–4 (17–41 gw) using stochastic modeling in scVelo, and projected onto stage-specific UMAP embeddings. Cells are colored by cluster annotations defined in Fig. 1b (f–g) and Fig. 2a (h–i). Dashed arrows indicate putative lineages. j–k UMAP plots showing the velocity z-scores and log-normalized expression of ZEB1 (left) and FOXO1 (right) along respective gIPC-O and gIPC-A lineage trajectories, in stage 3 (j) and stage 4 (k). Color scale in velocity plots corresponds to transcriptional induction (green) and repression or absence of transcription (red), inferred from the ratio of unspliced to spliced mRNA. See also Supplementary Figs. 7 and 8. RG radial glia, oRG outer radial glia, tRG truncated radial glia, EPD ependymal cell, AC astrocyte, gIPC glial intermediate progenitor cell, OPC oligodendrocyte progenitor cell, preOL premyelinating/early myelinating BCAS1+ oligodendrocyte, nIPC neuronal intermediate progenitor cell, mIPC multipotent intermediate progenitor cell CPN cortical projection neuron, IN interneuron.

