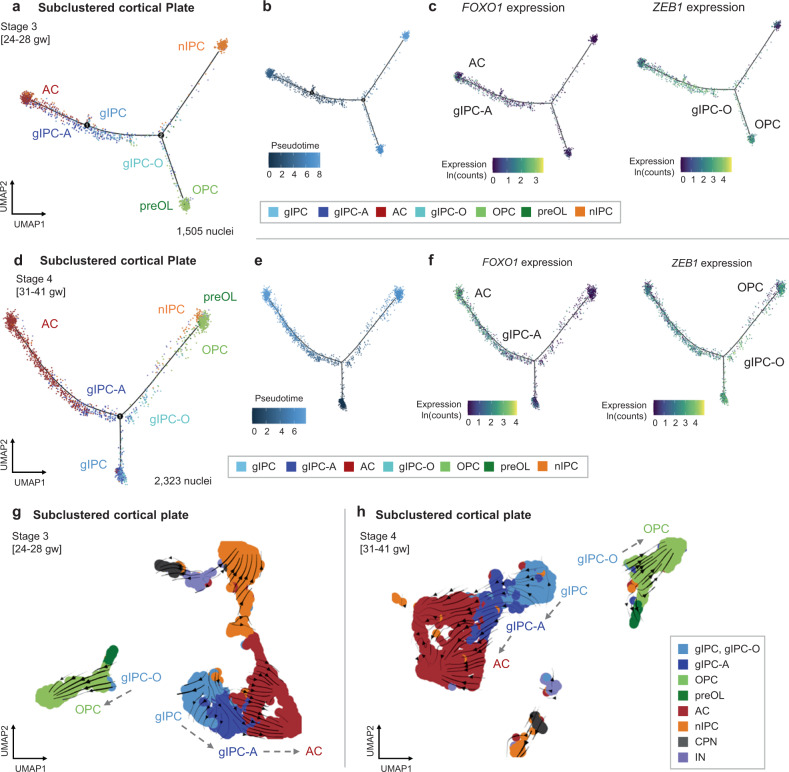
Fig. 6. Reconstruction of cell subtype lineages in the cortical plate.
a–f Trajectory analysis of CP lineages (subclustered cell type annotations from Fig. 2h) for stages 3 (a–c) and 4 (d–f) using Monocle2. Pseudotime (b, e) and the average log-normalized gene expression of FOXO1 (c, f; left), and ZEB1 (c, f; right) are also shown. gIPCs are selected as the root population. g–h Directionality analysis of CP cell types. Velocity vectors (solid arrows) calculated for stages 3 (g) and 4 (h) using stochastic modeling in scVelo, projected onto stage-specific UMAP embeddings. Cells are colored by cell subtype annotations from Fig. 2h. See also Supplementary Fig. 8. AC astrocyte, gIPC glial intermediate progenitor cell, OPC oligodendrocyte progenitor cell, preOL premyelinating/early myelinating BCAS1+ oligodendrocyte, nIPC neuronal intermediate progenitor cell, CPN cortical projection neuron IN interneuron, CP prenatal cortical plate, gw gestational weeks.

