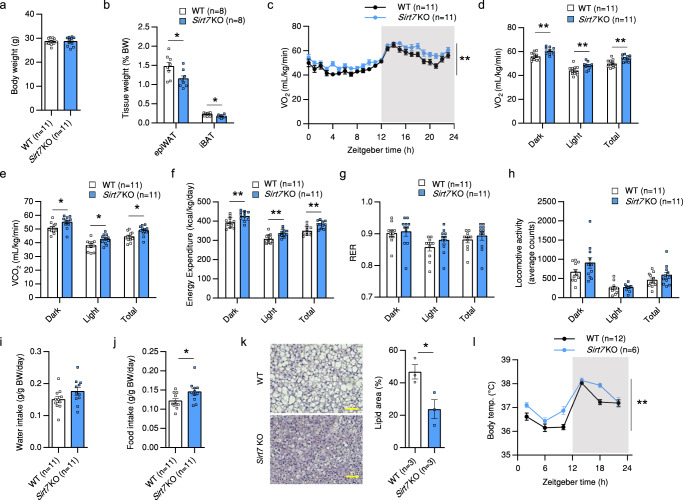
Fig. 1. Sirt7 KO mice display elevated energy expenditure and body temperature under normal conditions.
a, b Body weight (a) and percent epiWAT and iBAT weight calculated relative to body weight (b) in 15-week-old male WT and Sirt7 KO mice. p = 0.0286 (epiWAT), p = 0.0288 (iBAT). c–j Data of indirect calorimetry experiments from 15-week-old male WT and Sirt7 KO mice. VO2 rates (c), average VO2 (d), average VCO2 (e), energy expenditure (f), RER (g), locomotor activity (h), water intake (i), and food intake (j). p = 0.0021 in (c); p = 0.0023 (Dark), p = 0.0082 (Light), p = 0.0021 (Total) in (d); p = 0.0255 (Dark), p = 0.0101 (Light), p = 0.0106 (Total) in (e); p = 0.0063 (Dark), p = 0.0049 (Light), p = 0.0026 (Total) in (f); p = 0.0296 in (j). k Representative H&E-stained sections of iBAT from 15-week-old male WT and Sirt7 KO mice (left panel, scale bar = 50 μm), and quantification of the lipid area (n = 3 independent animals per group) (right panel). p = 0.0347. l Oscillation of body temperature in 10-week-old male WT and Sirt7 KO mice. p = 0.0013. Data are presented as means ± SEM. All numbers (n) are biologically independent samples. Two-way ANOVA with Bonferroni’s multiple comparisons test (c, l); two-tailed Student’s t-test (a, b, d–k). *p < 0.05; **p < 0.01. Source data are provided as a Source Data file.

