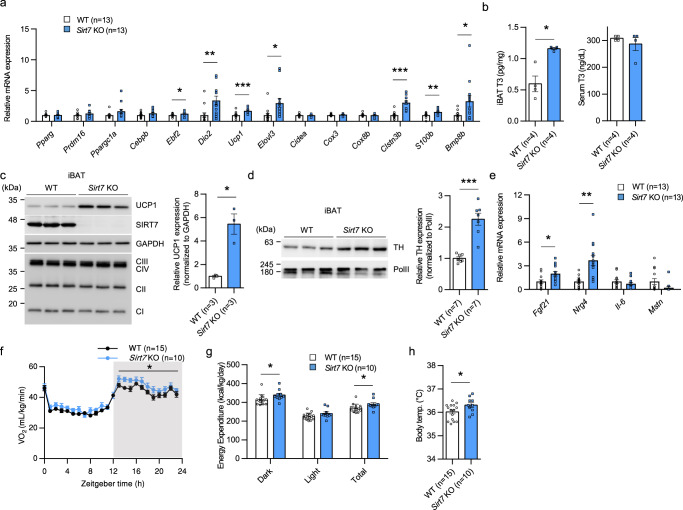
Fig. 3. SIRT7 suppresses energy expenditure and thermogenesis via multiple pathways.
a Real-time qPCR analysis of BAT-related genes in iBAT of 15-week-old male WT and Sirt7 KO mice. p = 0.0288 (Ebf2), p = 0.0098 (Dio2), p = 0.0003 (Ucp1), p = 0.0206 (Elovl3), p = 3.4E–06 (Clstn3b), p = 0.0053 (S100b), p = 0.0296 (Bmp8b). b T3 level in iBAT and serum of 13-week-old male WT and Sirt7 KO mice. p = 0.0192. c Western blot analysis of UCP1 and OXPHOS complexes I–IV in iBAT of 15-week-old male WT and Sirt7 KO mice (left panel), and quantification of the UCP1 protein bands relative to GAPDH control (right panel). p = 0.0347. d Western blot analysis of tyrosine hydroxylase (TH) in iBAT of 15-week-old male WT and Sirt7 KO mice (left panel), and quantification of the TH protein bands relative to RNA Polymerase II (Pol II) control (right panel). p = 0.0005. e Real-time qPCR analysis of batokine genes in iBAT of 15-week-old male WT and Sirt7 KO mice. p = 0.0109 (Fgf21), p = 0.0016 (Nrg4). f–h Data of indirect calorimetry experiments and body temperature from 20-week-old male WT and Sirt7 KO mice at thermoneutrality. VO2 rates (f), energy expenditure (g), and body temperature at ZT10 (h). p = 4.5E–02 (Dark) in (f); p = 0.0386 (Dark), p = 0.0473 (Total) in (g); p = 0.0439 in (h). Data are presented as means ± SEM. All numbers (n) are biologically independent samples. Two-way ANOVA with Bonferroni’s multiple comparisons test (f); two-tailed Student’s t-test (a–e, g–h). *p < 0.05, **p < 0.01, ***p < 0.001. Source data are provided as a Source Data file.

