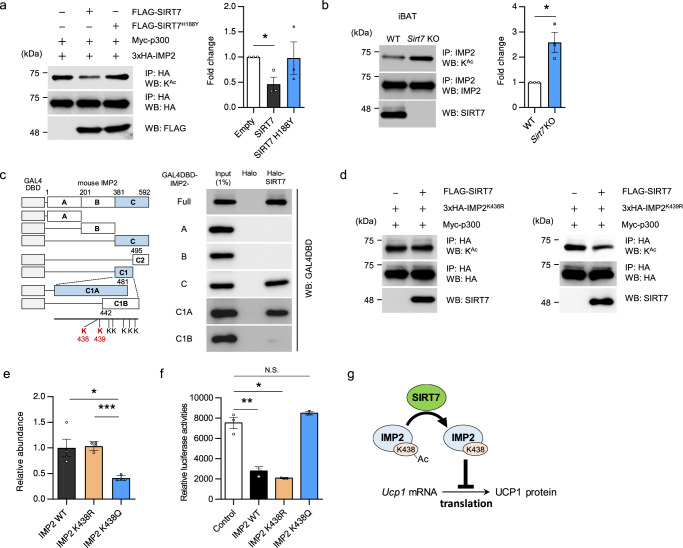
Fig. 8. Deacetylation of IMP2 by SIRT7 attenuates the translation of Ucp1 mRNA.
a The effect of SIRT7 overexpression on IMP2 acetylation. HEK293T cells were transfected with the indicated expression plasmid, and IMP2 acetylation was assessed by IP and WB (left panel). Quantification of the acetylated IMP2 relative to IMP2 (n = 3) (right panel). p = 0.0174. b The effect of Sirt7 deficiency on IMP2 acetylation. Protein lysates of iBAT were subjected to IP, after which the acetylated IMP2 was detected by WB (left panel). Quantification of the acetylated IMP2 relative to IMP2 (n = 3) (right panel). p = 0.0170. c Mapping of the region of the interaction between IMP2 and SIRT7. Halo-SIRT7 pull-down assay with lysates of HEK293T cells expressing the indicated IMP2 deletion mutants fused with GAL4DBD. See also Supplementary Fig. 6a. d The effect of SIRT7 overexpression on IMP2K438R and IMP2K439R acetylation. HEK293T cells were transfected with the indicated expression plasmid, and IMP2 acetylation was assessed by IP and WB. Quantification of the acetylated IMP2 is shown in Supplementary Fig. 6b. e Binding between in vitro-transcribed long Ucp1 3′-UTR and IMP2 (IMP2WT, IMP2K438R, IMP2K438Q) (n = 4 independent samples per group). p = 0.0401 (IMP2WT vs. IMP2K438Q), p = 1.7E-05 (IMP2K438R vs. IMP2K438R). f The effect of IMP2 mutant on the translation of luciferase-Ucp1 UTR fusion mRNA. luciferase-Ucp1 UTR mRNA was transcribed in vitro and used in an insect cell-free translation system with recombinant protein in E. coli for IMP2WT, IMP2K438R, and IMP2K438Q (n = 3 independent samples per group). Translation was estimated by the gain in luciferase activity after incubation for 5 h at 25 °C. p = 0.0016 (Control vs. IMP2WT), p = 0.0106 (Control vs. IMP2K438R). g Proposed model for the suppression of brown fat thermogenesis through attenuation of Ucp1 mRNA translation via SIRT7-dependent deacetylation of IMP2. See Discussion for details. WB western blotting, IP immunoprecipitation, N.S. not significant. Data are presented as means ± SEM. All numbers (n) are biologically independent samples. *p < 0.05, **p < 0.01 by two-tailed Student’s t-test. Source data are provided as a Source Data file.

