Figure 1.
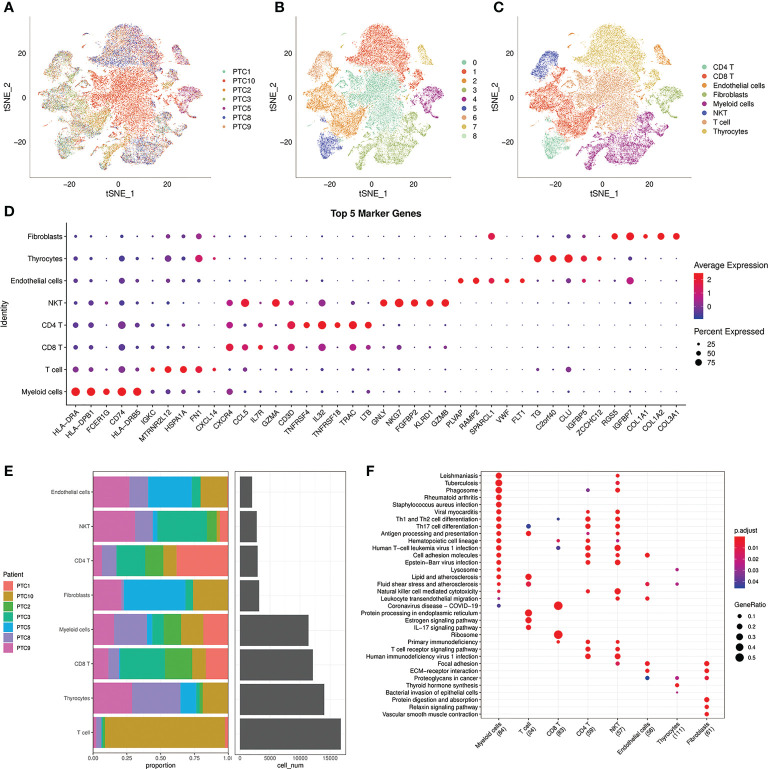
Analysis of 8 cell lineages. (A) t-SNE plot of filtered cells colored by samples. (B) t-SNE plot of filtered cells colored by clusters. (C) The cell lineages were identified by marker genes: CD4 T, CD8 T, endothelial cells, fibroblasts, myeloid cells, NK T, T cells, thyrocytes. (D) The expression of the first 5 marker genes in each cell lineages. The size of the dot represents the fraction of cells in which the gene was detected. The color of the dot represents the average expression of the cells in each lineage. (E) The proportion of cells from 7 PTC samples in 8 cell lineages. (F) KEGG enrichment analysis of 8 cell lineages.

