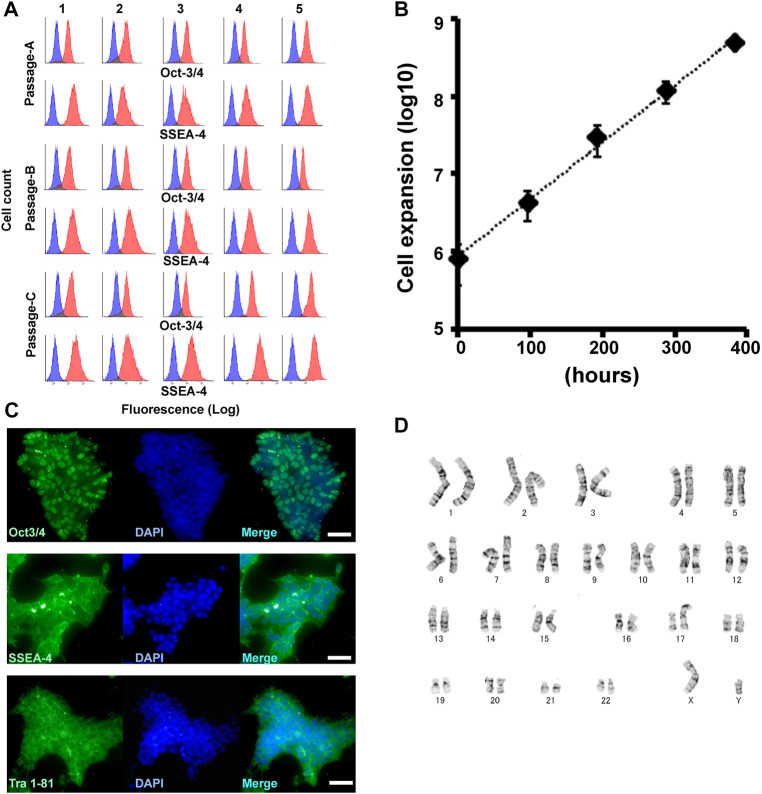
FIGURE 3.
Automated long-term maintenance of iPSC. (A) All immunocytometorical analyses of the three independent experiments for Oct-3/4 and SSEA-4. Each blue histogram indicates no primary antibody control. Each red histogram represents the indicated antigen-specific signal. (B) iPSC expansion calculated using every automated cell count in the three independent experiments. (C) Representative images of immunohistochemically stained cells for Oct-3/4, SSEA-4, and Tra 1–61. Scale bars = 50 μm. (D) Karyotype of the RIKEN2F-iPSC after the fifth passage.

