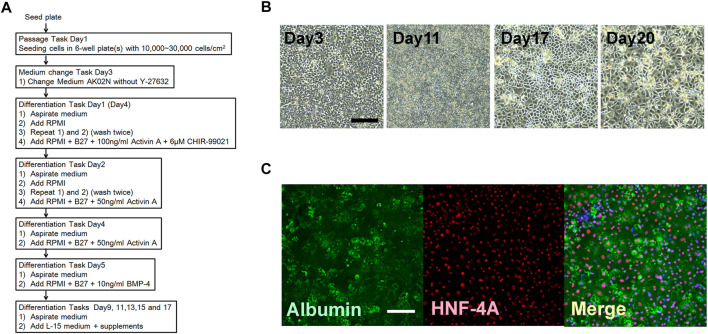
FIGURE 5.
Hepatocyte differentiation using the human iPSC (RIKEN2F). (A) Schedule of the combination of processes including passage and differentiation. (B) Step by step changes in the cell figures based on phase contrast micrography. Scale bar = 100 μm. (C) Immunohistochemical staining for Albumin: green, and hepatocyte nuclear factor 4 alpha (HNF-4A): red. The nucleus was stained with DAPI. Scale bar = 100 μm.

