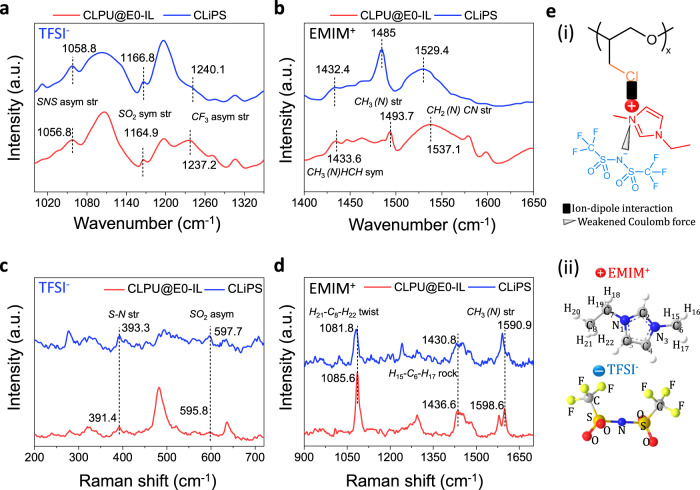
Fig. 3. Molecular characterization of CLiPS.
ATR-FTIR spectra of CLPU@E0-IL (used as reference) and CLiPS films. ATR-FTIR spectra in the spectral regions of a, 1000–1350 cm−1 (pertaining to TFSI− stretching) and b, 1400–1650 cm−1 (pertaining to EMIM+ stretching). c, d Raman spectra in the ranges of 200–720 cm−1 and 900–1700 cm−1 corresponding to TFSI- and EMIM+ vibrational bands, respectively. These spectra confirm the trapping of ion pairs to Cl groups via ion–dipole and Coulombic interactions. e (i) Schematic presenting of ion–dipole interaction between Cl groups and the [EMIM]+ cation, and Coulomb force between ion pairs, (ii) atomic number scheme of [EMIM]+ utilized in (d), and atomic structure of [TFSI]−.

