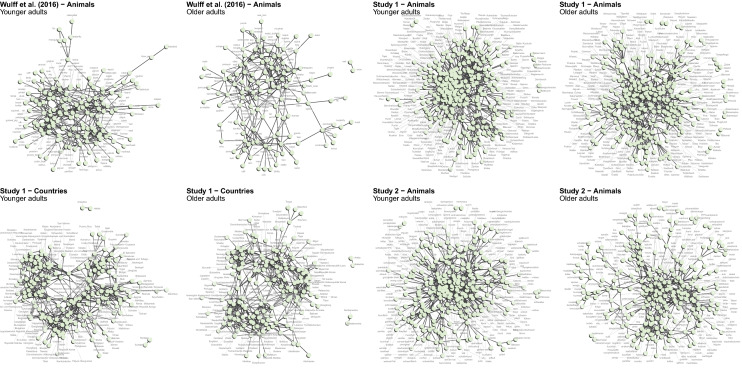
Figure 2.
Fluency networks. The figure shows the networks estimated for younger and older adults in each of the four data sets analyzed. Labels are not displayed on top of their nodes so as not to obscure the structural characteristics of the network. The figures suggest similarity in the semantic networks of the two age groups, with clustering of semantic-related items in close proximity. For details on the network inference mechanism, see Methods.

