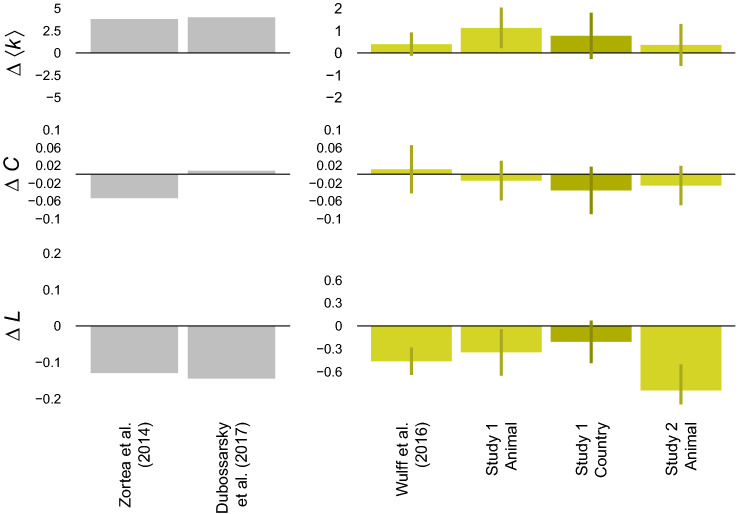
Figure 3.
Differences in the macroscopic structure of younger and older adults’ fluency networks. Gray bars show the difference between the younger and older adults’ age group in Zortea et al.40 and that of age 30 and 70 in Dubossarsky et al.18, respectively. Yellow bars show differences in networks inferred from the four fluency data sets. Error bars show 95% bootstrapped confidence intervals. Note: -Differences in average degrees; -Difference in average clustering coefficients; -Difference in average shortest path lengths.

