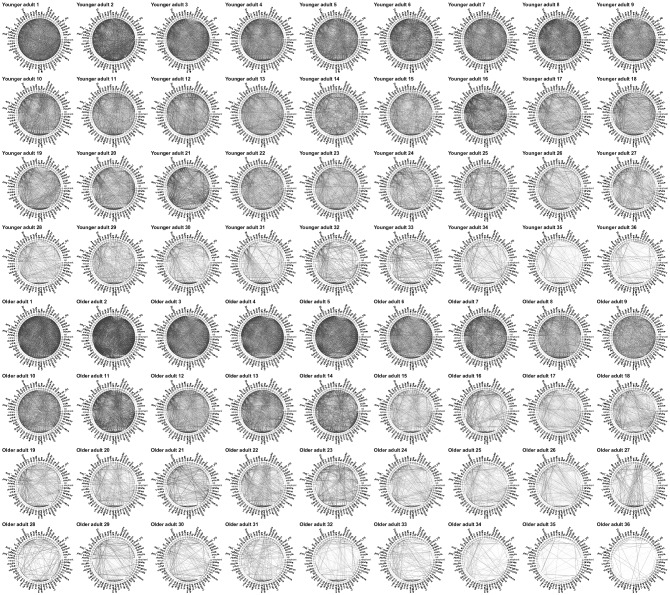
Figure 4.
Similarity rating networks. Each individual plot shows the network of one individual under . The first four rows show the networks of younger adults, the bottom four rows those of older adults. Please note that networks are ordered by network strength to facilitate a visual comparison of between- and within-group variability in network structure. Edges’ weights have been scaled according to to increase visibility. Nodes are ordered and colored according to ten animal categories. These are, starting at , African animals (plus kangaroo), large apes, birds, farm animals, fish, forest animals, pets, reptiles, and rodents. Animals names were translated from German.

