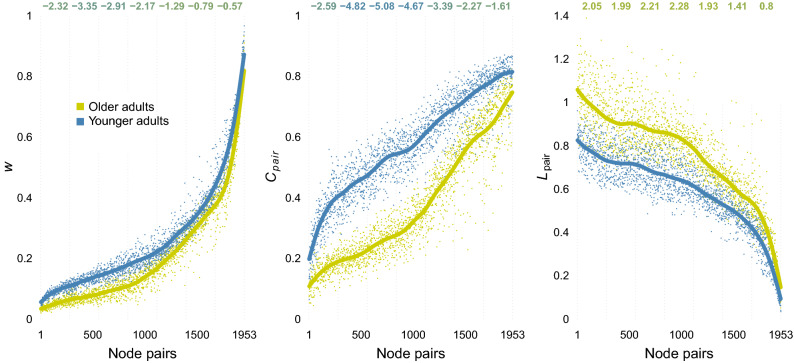
Figure 6.
Comparisons between younger and older adults’ networks across all 1,953 node pairs. The panels show separately for younger (blue) and older (yellow) adults the average edge weights under (left panel), the proportion of triangles that existing edges form with other edges under (middle panel), and the shortest paths between the nodes (bottom panel). The numbers on top of each panel show the Cohen’s d (younger–older adults) for bins of 200 node pairs. Note: w—Edge weight; —Proportion of triangles formed by pair; —Distance between between nodes in pair.

