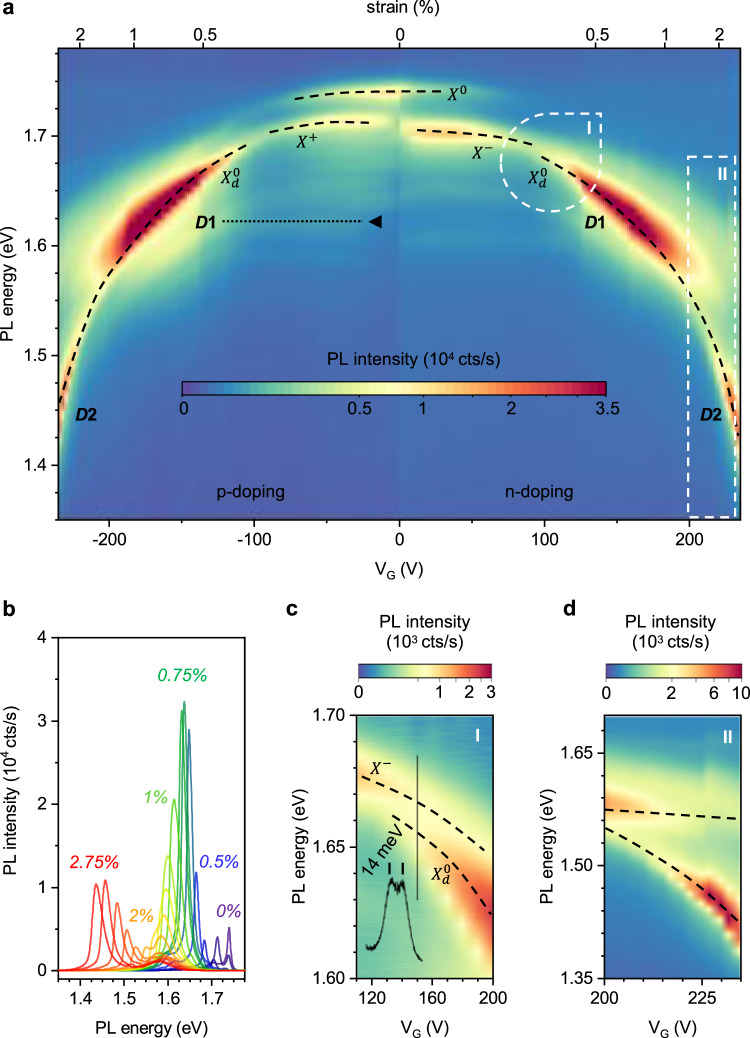
Fig. 3. Strain response of excitonic states in WSe2 at 100 K.
a PL spectra map of a suspended WSe2 monolayer (device 1) at T = 100 K with individual spectra shown in (b). Free excitonic states red-shift with increasing strain (the dashed lines are a guide to the eye). The state develops strong intensity maxima at energies 1.63 eV (D1) and 1.45 eV (D2). The strain-independent states close to the position of D1 that we associate with defects are marked with dashed lines. See Supplementary Fig. 1 for an offset plot of the PL spectra. c High-resolution map of the region “I" from another device (device 2). The state X− disappears with increasing strain while the state arises ~ 14 meV below it. d Detailed map of the region “II" from device 1 showing a maximum near ~ 1.4 eV and an avoided-crossing pattern.

