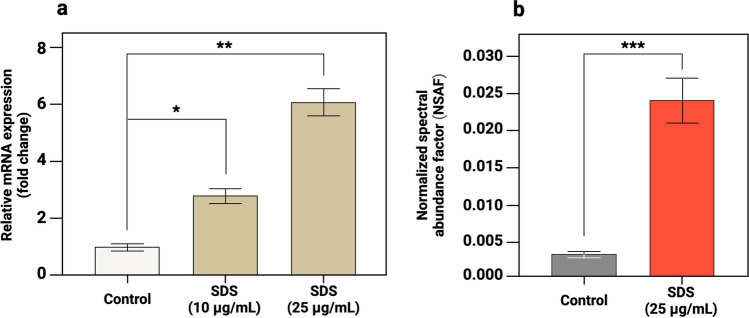
Figure 6.
The mRNA expression levels of MCM6 and corresponding MCM6 proteomic profiles in control and SDS-exposed HaCaT cells. Histograms show (a) the fold change in MCM6 expression in SDS-exposed cells compared to control cells; (b) protein abundance of MCM6 assessed via LC–MS/MS analysis. The significant upregulations are marked with asterisks (*P = 3.8e−5; **P = 2.8e−5; ***P = 3.0e−4; at alpha level 0.05). Error bars represent the standard deviation between technical repeats.

