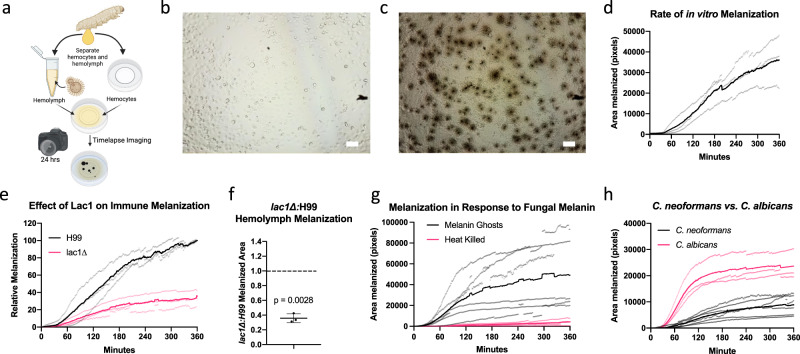
Fig. 2. Using in vitro time-lapse microscopy to visualize the melanin-based immune response.
a Using a developed time-lapse microscopy protocol, we were able to record the dynamics of hemolymph melanization in response to C. neoformans from 0 (b) up to 24 h (c). We can then use particle measurement software to visualize and quantify the melanization reactions over time (d), representative of three biological replicates. This method can be used to gain insight into how different virulence factors, such as laccase, influence the melanization response, where we see that the laccase knockout mutant causes less of a melanization response without much change in time until onset of melanization (e), represented by three biological replicates, and normalized to the wild-type control melanization area at 360 min. f Overall, the lac1∆ triggers ~40% as much of a melanization immune response compared to the WT (one sample t-test, n = 3 biologically independent movies, p = 0.0028, t = 18.78, df = 2). g Isolated fungal melanins are associated with activation of the insect-melanin-based immune response, whereas the heat-killed acapsular cryptococcal cells are not, as represented by 3–6 biological replicates. h Additionally, we can compare the activation of the melanin-based immune response from different fungal species such as C. neoformans and C. albicans, which strongly activates the melanization immune response, represented by 3–6 biological replicates. b–d, g are representative images and graphs from three biological replicates. Error bars indicate Standard Deviation. d, e, g, h Solid lines indicate mean melanization, and light colored points indicate individual replicate data points. Scale bars represent 50 µm.

