Figure 2.
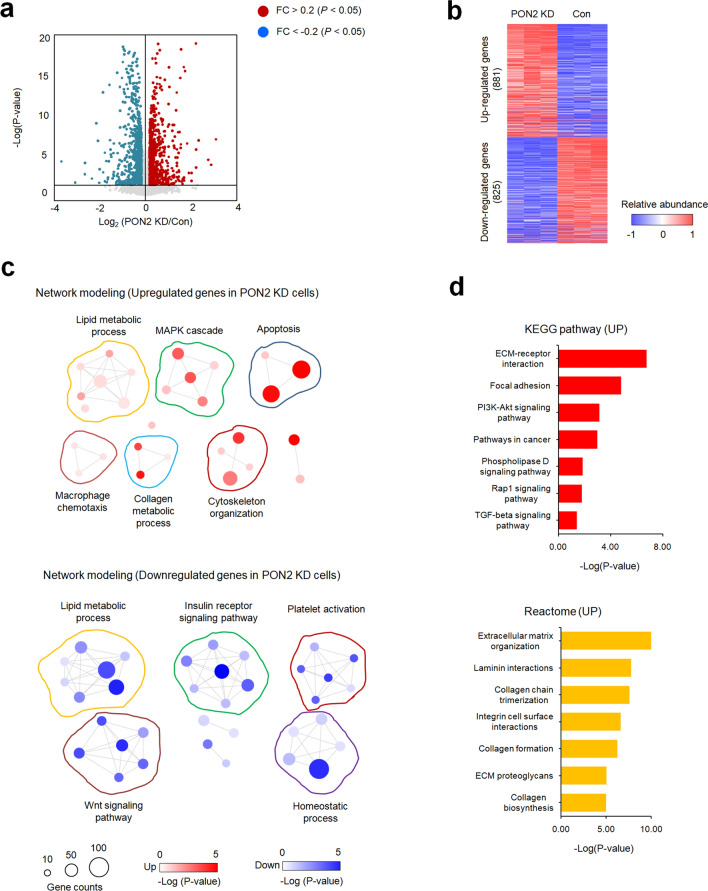
Transcriptome analyses using RNA-seq data in PON2-deficient and control cells. (a) Volcano plot of hepatic differentially expressed genes (DEGs) between the PON2 depletion and control. Genes upregulated or downregulated by more than 1.2-fold are shown in red and blue, respectively. (b) Two-dimensional hierarchical clustering of DEGs between different pairs of PON2-deficient and control cells. In total, 881 and 825 genes are upregulated and downregulated by PON2 depletion compared to that in control, respectively. (c) Network modeling scheme showing the most significant Gene Ontology (GO) biological processes for each cluster of genes upregulated (upper panel) and downregulated (bottom panel) in PON2-deficient cells relative to that in the control cells. Red and blue denote highly and weakly expressed genes, respectively, and circle size indicates gene counters. The legends for color-coding and gene counting are shown below. (d) Top-ranked pathways that are significantly altered in PON2-deficient cells relative to those in control cells. Upper panel represent the KEGG pathways enriched by genes exhibiting upregulated expression in PON2-deficient cells relative to those in control cells. Bottom panel represent the Reactome pathways enriched by the genes exhibiting upregulated expression in PON2-deficient cells relative to those in control cells. Each cell is color-coded based on the fold change in the expression of genes in PON2-deficient cells, relative to control cells.

