Figure 3.
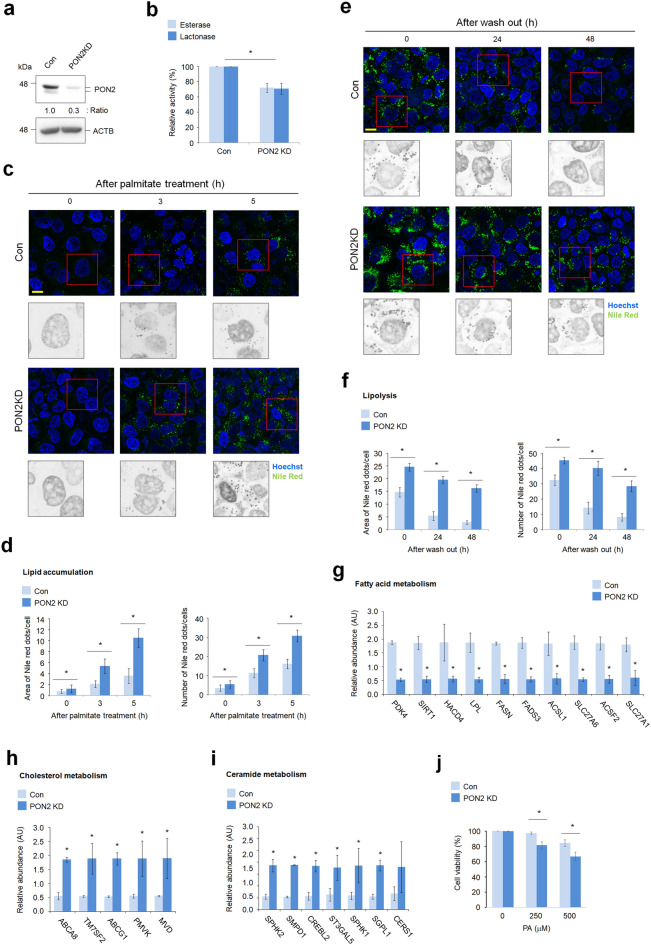
PON2 promotes lipid catabolic pathways in hepatocytes. (a) Immunoblot analysis of PON2 expression in PON2-deficient and control cells. ACTB was used as a loading control. Band intensities of the indicated proteins are shown below. (b) Endogenous PON2 activities in the PON2-deficient and control L02 cells. Bar plots of the average esterase and lactonase activities are shown (n = 3). (c) Confocal fluorescence analysis showing time-dependent lipid accumulation after PA treatment in PON2-deficient and control cells. Cells were stained with Nile red at indicated time after PA treatment (n = 3; scale bar = 50 μm). (d) Quantification of Nile red staining intensities is measured by the area of Nile red dots per cells and by the number of Nile red dots per cells. (e) Confocal fluorescence analysis showing lipolysis activity in PON2-deficient and control cells. Cells were treated with PA for 24 h, replenished with normal growth media, and then stained with Nile red at the indicated time after wash out of PA. Representative images from three independent experiments are shown (scale bar = 50 μm). (f) Quantification of Nile red staining intensities is measured by the area of Nile red dots per cells and by the number of Nile red dots per cells. (g) The expression of genes related to FA metabolism in PON2-deficient cells relative to that in control cells. (h) The expression of genes related to cholesterol metabolism in PON2-deficient cells relative to that in controls. Bar plots of the average expression of genes are shown. (i) The expression of genes related to ceramide metabolism in PON2-deficient cells relative to that in controls. (j) PA-mediated lipotoxicity in PON2-deficient cells compared to the control cells. Error bars indicate standard deviation. Statistical significance between two groups was determined with two-tailed Student’s t test. *p < 0.05.

