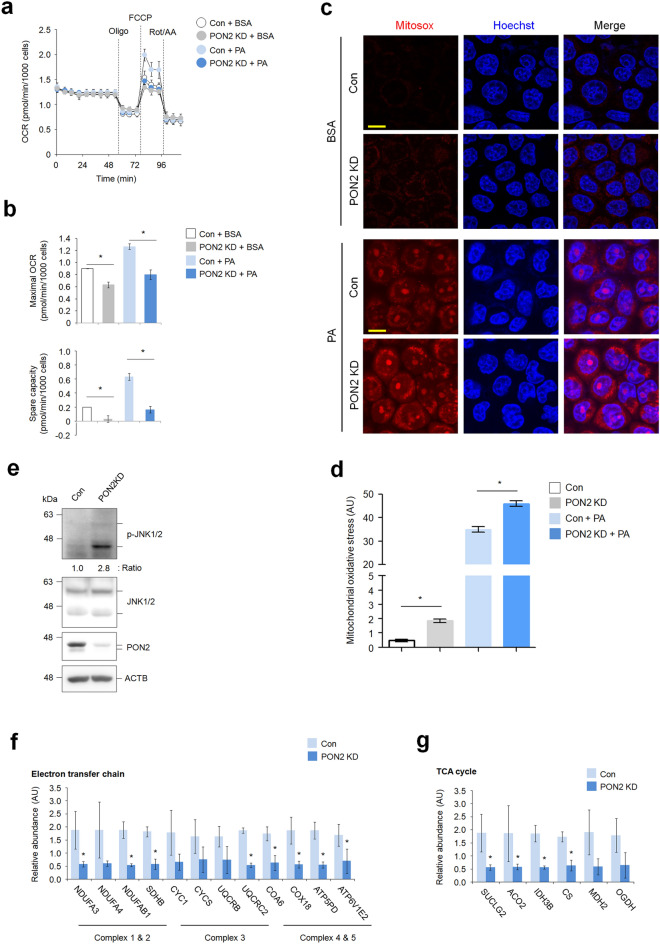
Figure 4.
PON2 depletion impairs mitochondrial metabolism and oxidative stress. (a) Seahorse measurement of oxygen consumption rate (OCR) in PON2-deficient and control cells treated with or without PA. (b) Bar plots of maximal OCR and spare respiratory capacity are shown. Data were obtained from three independent experiments. (c) Confocal fluorescence images showing the generation of mitochondrial superoxide, which was analyzed using MitoSox. PON2-deficient and control cells were treated with or without PA for 24 h and stained with MitoSox. Cell nuclei were stained with Hoechst 33342. Representative images from three independent experiments are shown above (scale bar = 50 μm). (d) Bar plots of the MitoSox staining intensity are shown below. (e) Immunoblotting analysis of phosphorylation of JNK1/2 as marker for mitochondrial oxidative stress in PON2-deficient and control cells. ACTB was used as a loading control. Band intensities of indicated proteins are shown below. (f) The expression of genes related to mitochondrial electron transfer chain in PON2-deficient cells relative to controls. Bar plots of the average expression of genes are shown. (g) The expression of genes related to mitochondrial TCA cycle in PON2-deficient cells relative to controls.

