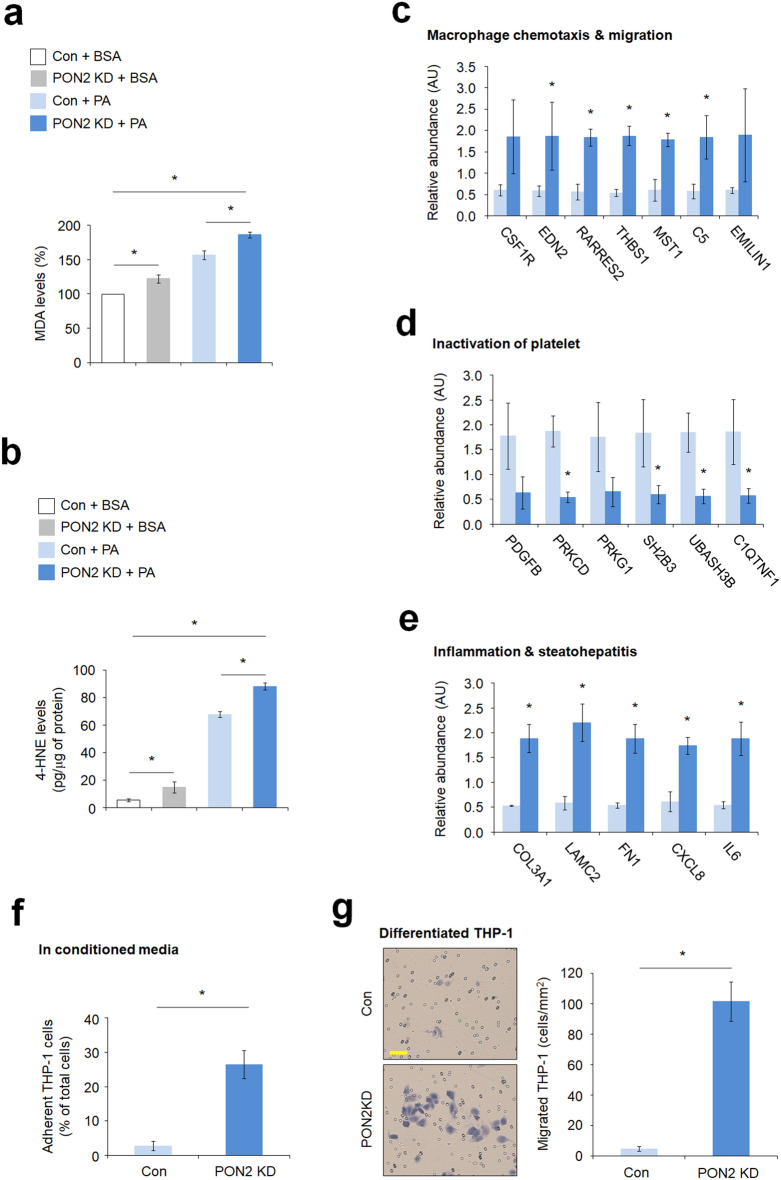
Figure 5.
PON2 depletion increases lipid peroxidation and inflammatory response. (a) The quantification of the malonaldehyde adducts in PON2-deficient and control cells treated with or without PA for 24 h. Bar plots of the average lipid peroxidation. Data were obtained from three independent experiments. Error bars indicate standard deviation. (b) The quantification of 4-hydroxynonenal adducts in PON2-deficient and control cells treated with or without PA for 24 h. (c) The expression of genes related to macrophage chemotaxis and migration in PON2-deficient cells relative to that in controls. (d) The expression of genes related to inactivation of platelet in PON2-deficient cells relative to that in controls. (e) The expression of genes related to inflammation and steatohepatitis in PON2-deficient cells relative to that in control cells. (f) THP-1 adhesion assay in conditioned media of PON2-deficient and control cells. (g) Chemotaxis analysis of differentiated THP-1 macrophages against PON2 deficient and control cells. Representative images from three independent experiments were shown in the left panel (scale bar = 50 μm). Bar plots of migrated THP-1 cells/mm2 were shown in the right. Error bars indicate standard deviation. Statistical significance between two groups was determined with two-tailed Student’s t test. *p < 0.05.

