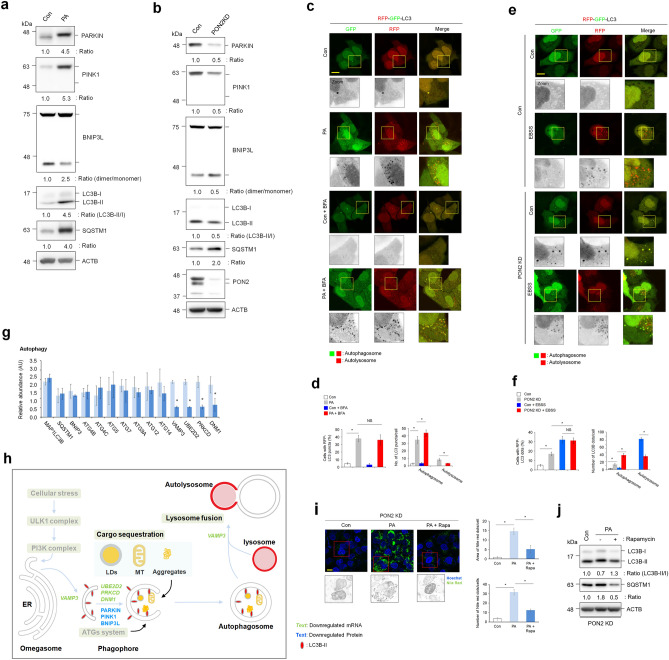
Figure 6.
PON2 depletion inhibits autophagosome formation and autolysosome maturation. (a) Immunoblotting analysis of autophagy pathway activation-related markers (PARKIN, PINK1, BNIP3L, LC3B, and SQSTM1) in cells treated with PA for 24 h. ACTB was used as a loading control. The band intensities of indicated proteins are shown below. (b) Immunoblotting analysis of autophagy pathway activation-related markers (PARKIN, PINK1, BNIP3L, LC3B, and SQSTM1) in PON2-deficient and control cells. ACTB was used as a loading control. The band intensities of indicated proteins are shown below. (c) Confocal fluorescence analysis showing the PA-mediated autophagy activation. Cells were transfected with tandem fluorescent probe-tagged LC3B (red fluorescent protein (mRFP)-green fluorescent protein (GFP)-LC3B) plasmid and treated with or without PA for 24 h, followed by treatment with bafilomycin A (100 nM) for 5 h. Cells with both red and green fluorescent puncta (autophagosome) and those with only red fluorescent puncta (autolysosome) were quantified. Representative images from three independent experiments are shown above (scale bar = 50 μm). (d) Bar plots of the average cell numbers with red fluorescent puncta (autophagy) or average numbers of autophagosome or autolysosome per cell are shown below. (e) Confocal fluorescence analysis showing the autophagy activation in PON2-deficient and control cells. Cells were transfected with mRFP-GFP-LC3B plasmid, replenished with EBSS for 5 h. Cells with both red and green fluorescent puncta (autophagosome) and those with only red fluorescent puncta (autolysosome) were quantified. Representative images from three independent experiments are shown above (scale bar = 50 μm). (f) Bar plots of the average cell numbers with red fluorescent puncta (autophagy) or average numbers of autophagosome or autolysosome per cell are shown below. (g) The expression of genes related to autophagy activation in PON2-deficient cells relative to that in controls. Bar plots of the average expression of genes are shown. (h) Schematic representation of the hepatic autophagy pathway showing genes with significant changes in their expression in PON2-deficient cells relative to that in control cells. Downregulated mRNA and protein expression are indicated by green and blue characters, respectively. Gray characters indicate unaffected autophagy pathway in PON2-deficient cells compared to that in control cells, whereas black characters show the potentially affected pathway by PON2 depletion. (i) Confocal fluorescence analysis showing PA-induced lipid accumulation with or without rapamycin autophagy activator. PON2-deficient cells were treated with PA alone (100 μM) or in combination with rapamycin (100 nM) for 24 h and stained with Nile red to determine lipid accumulation. Representative images from three independent experiments were shown in the left (scale bar = 50 μm). Quantification of Nile red staining intensity which was measured as the area of Nile red dots per cell and the number of Nile red dots per cell. (j) Immunoblot analysis of autophagy pathway activation-related markers (LC3B and SQSTM1) in PON2-deficient cells treated with PA alone or in combination with rapamycin for 24 h. ACTB was used as a loading control. The band intensities of the indicated proteins were shown below. Error bars indicate standard deviation. Statistical significance between two groups was determined with two-tailed Student’s t test. *p < 0.05. NS, non-significant.

