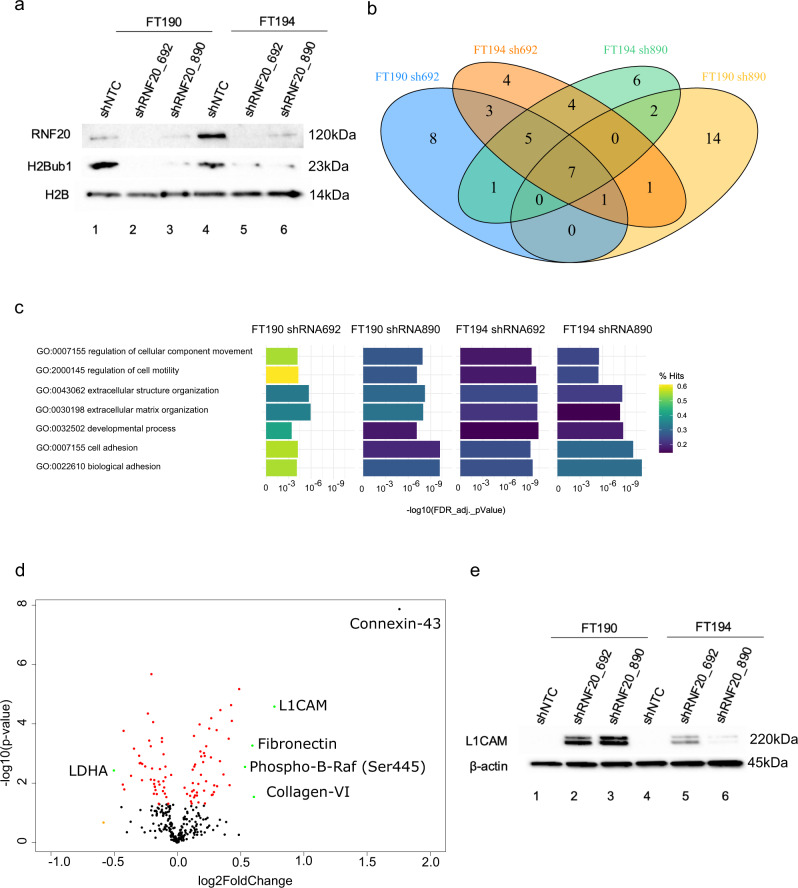
Fig. 2. Loss of RNF20 leads to the upregulation of L1CAM.
a Western blot analysis of RNF20, H2Bub1, and H2B in FT190 and FT194 treated with two shRNAs targeting RNF20 or a control shRNA. b Venn diagram of the 25 most enriched pathways in FT190 and FT194 cells that were treated with two shRNAs (sh890 or sh692) to knockdown the RNF20 E3 ligase. c Display of the 7 pathways that overlap with all conditions in A. Bar graphs represent the False Discovery Rate (FDR) adjusted p-value in -log10 scale. The color represents percentage of regulated genes in each pathway. d Volcano plot of FT190 cells treated with RNF20 shRNA and analyzed with RPPA. Red dots depict the proteins that are significantly regulated. Orange dots depict samples that are regulated over 0.5 log2 fold (1.4 fold) and green depicts proteins that are significantly and 0.5 log2 fold regulated. e Western blot analysis of L1CAM and beta Actin in FT190 and FT194 treated with two shRNAs targeting RNF20 or a control shRNA.

