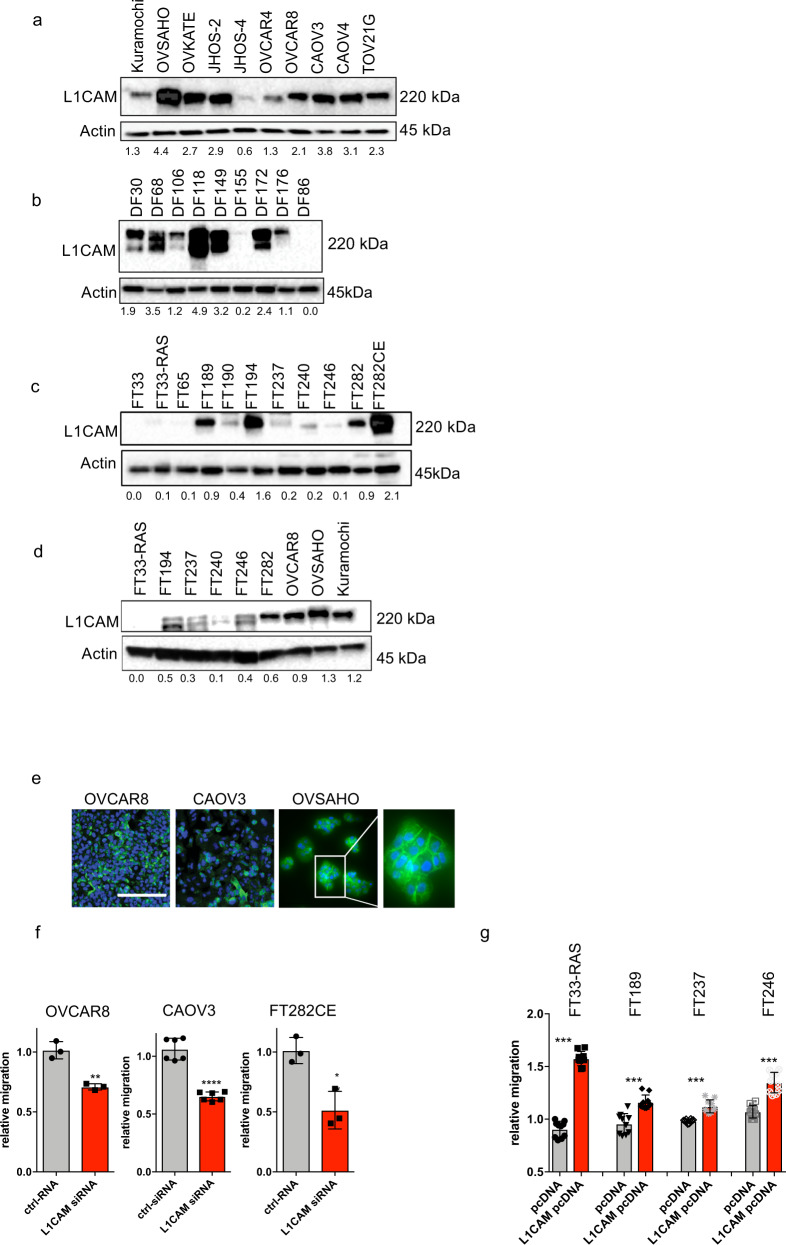
Fig. 4. L1CAM expression in Ovarian cancer and primary cell lines.
Western blot analysis of L1CAM expression in ovarian cancer cell lines (a) primary ascites-derived HGSC cells (b) and immortalized fallopian tube cell lines (c) and a panel comparing immortalized fallopian tube cell lines to ovarian cancer cell lines (d). Actin was used as a loading control. Relative L1CAM expression was calculated by the ratio of the densitometry of L1CAM divided by Actin. e Immunofluorescence images of selected cell lines for surface L1CAM (green) and DAPI (blue) to stain the nucleus. f Relative migration in OVCAR8, CAOV3 and FT282-CE after siRNA knock-down of L1CAM or treatment with control siRNA. g Relative migration in FT33-RAS, FT189, FT237 and FT246, measured after overexpression of L1CAM or an empty control vector. e Scalebar represents 100 µm. f, g Three independent experiments were performed and P-values were calculated with an unpaired two-sided t-test. *p < 0.05, **p < 0.01, ***p < 0.001, ****p < 0.0001.

