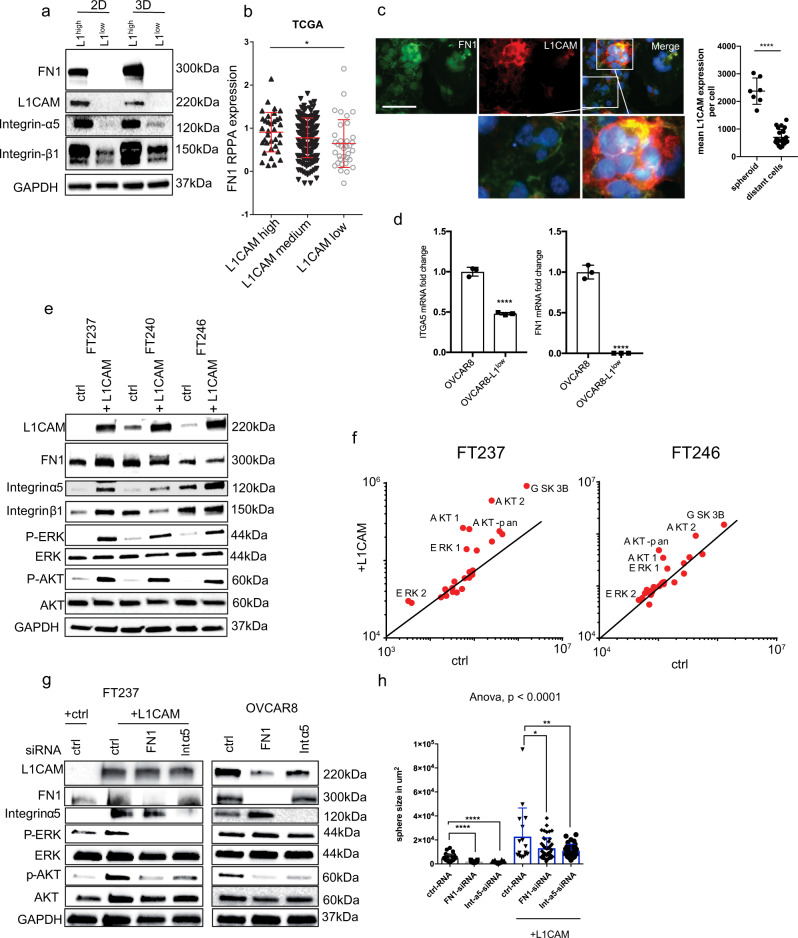
Fig. 7. L1CAM regulates the expression of fibronectin during 3D sphere formation.
a Western blot analysis of fibronectin, Integrin ɑ5, Integrin β1, Integrin β3, L1CAM and GAPDH in OVCAR8 and OVCAR8-L1low under 2D and 3D culturing conditions. Representative experiment (n = 5) is shown. b Dot plot representing fibronectin RPPA protein expression in ovarian cancer tumors of the TCGA cohort with a high, medium and low L1CAM mRNA expression. c Fluorescent images representing L1CAM (red) and fibronectin (green) in OVCAR8 cells cultured under 3D conditions before re-seeding on coverslips for fixation. Scalebar represents 200 µm. d mRNA fold change of Integrin alpha 5 (left) and Fibronectin (right) measured by quantitative real time PCR in OVCAR8 and OVCAR8-L1low cells. e Western blot analysis of FT237, FT240 and FT246 transfected with either L1CAM or a control vector. Representative Western blot (n = 3) is shown. f Scatter plot representing protein kinase array in FT237 and FT246 expressing control plasmid and plasmid-containing L1CAM. g Western blot analysis of FT237 and OVCAR8 analyzed 72 h after siRNA treatment, targeting fibronectin, Integrin ɑ5. Representative Western blot (n = 3) is shown (h) Box plot representing quantification of sphere size of FT237-ctrl and FT237 + L1CAM after siRNA knockdown of fibronectin or Integrin ɑ5. Three independent experiments were performed (b, c). P-values were calculated with an unpaired two-sided t-test. *p < 0.05, **p < 0.01, ***p < 0.001, ****p < 0.0001. h ANOVA and Dunnett multiple comparison tests were used to calculate significance.

