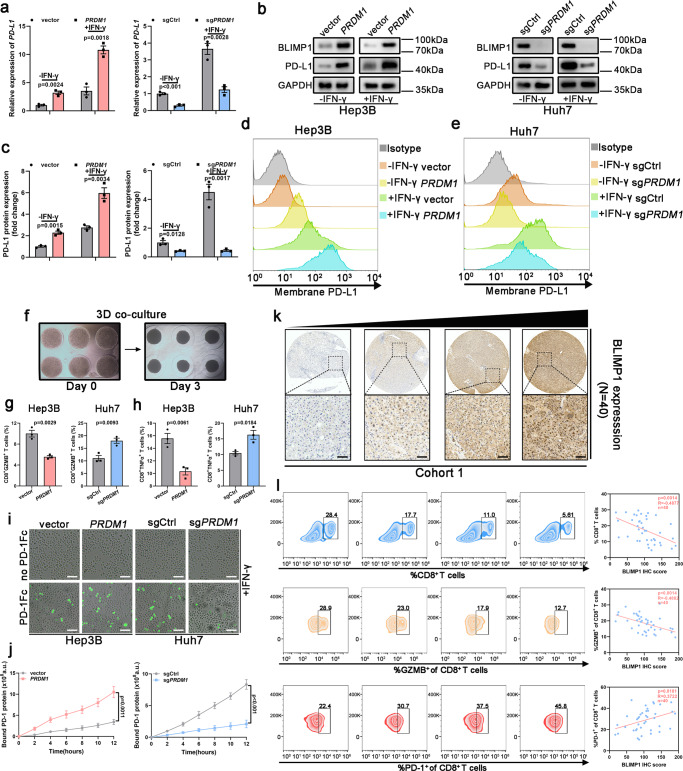
Fig. 1. PRDM1 upregulates PD-L1 expression in HCC.
a qRT-PCR of PD-L1 expression in Hep3B cells or Huh7 cells with or without IFN-γ treatment. Data presented as mean ± SEM (n = 3 independent biological replicates). b, c Western blotting of PD-L1 expression in Hep3B cells or Huh7 cells with or without IFN-γ treatment. Representative of n = 3 independent biological replicates. d, e Flow cytometry analysis of PD-L1 expression in Hep3B cells (d) or Huh7 cells (e) with or without IFN-γ treatment. n = 3 independent biological replicates. f 3D-co-culture model using pre-activated T cells and Hep3B or Huh7 cells. g Flow cytometry analysis of CD8+GZMB+ cell content in pre-activated T cells following 72 h of co-culture with Hep3B or Huh7 cells. Data presented as mean ± SEM (n = 3 independent biological replicates). h Flow cytometry analysis of CD8+TNFα+ cell content in pre-activated T cells following 72 hours of co-culture with Hep3B or Huh7 cells. Data presented as mean ± SEM (n = 3 independent biological replicates). i Time-lapse microscopic images revealing the binding of Hep3B or Huh7 cells with PD1 at 12 h. Scale bars, 100 µm. j Analysis of PD1/Fc protein binding on Hep3B and Huh7 cells at 2 h. Data presented as mean ± SEM (n = 3 independent biological replicates). k Immunohistochemical staining of BLIMP1 protein in HCC samples (Cohort 1). Scale bars, 100 µm. l Correlation analysis of tumoral BLIMP1 protein expression and tumor-infiltrating T cell content. Pearson analysis revealed a negative correlation between tumoral BLIMP1 protein expression and CD8+ T cells and the activity (GZMB+) of infiltrated CD8+ T cells in infiltrating CD45+ cells and a positive correlation between tumor BLIMP1 protein expression and the percentages of PD1+ cells in CD8+ TILs. n = 40 patients. P value was determined by unpaired two-sided Student’s t test (a, c, g, h, j) and Pearson correlation analysis (l). Source data are provided as a Source data file.

