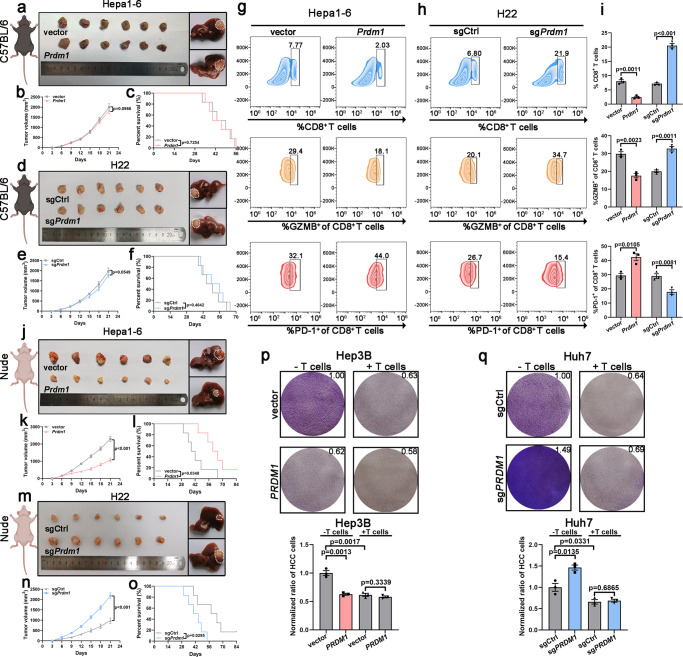
Fig. 2. Prdm1 attenuates its effects on tumor growth inhibition through PD-L1-induced tumor immune evasion in immune-competent mice.
a Representative subcutaneous tumors (left)/orthotopic transplantation tumors (right) collected from Hepa1-6-bearing C57BL/6 mice. b Tumor proliferation curves of subcutaneous xenografts in Hepa1-6-bearing C57BL/6 mice. Data presented as mean ± SEM. n = 6 mice per group. c Kaplan–Meier survival curves of Hepa1-6-bearing C57BL/6 mice. n = 6 mice per group. d Representative subcutaneous tumors (left)/orthotopic transplantation tumors (right) collected from H22-bearing C57BL/6 mice. e Tumor proliferation curves of subcutaneous xenografts in H22-bearing C57BL/6 mice. Data presented as mean ± SEM. n = 6 mice per group. f Kaplan-Meier survival curves of H22-bearing C57BL/6 mice. n = 6 mice per group. g–i Flow cytometry analysis of CD8+, GZMB+CD8+, and PD1+CD8+ in CD3+ TILs from Hepa1-6 (g) or H22 xenografts (h) in C57BL/6 mice and their quantification (i). Data presented as mean ± SEM. n = 3 mice per group. j Representative subcutaneous tumors (left)/orthotopic transplantation tumors (right) collected from Hepa1-6-bearing BALB/c nude mice. k Tumor proliferation curves of subcutaneous xenografts in Hepa1-6-bearing BALB/c nude mice. Data presented as mean ± SEM. n = 6 mice per group. l Kaplan–Meier survival curves of Hepa1-6-bearing BALB/c nude mice. n = 6 mice per group. m Representative subcutaneous tumors (left)/orthotopic transplantation tumors (right) collected from H22-bearing BALB/c nude mice. n Tumor proliferation curves of subcutaneous xenografts in H22-bearing BALB/c nude mice. Data presented as mean ± SEM. n = 6 mice per group. o Kaplan–Meier survival curves of H22-bearing BALB/c nude mice. n = 6 mice per group. p, q T cell-mediated cancer cell-killing assay results. Data presented as mean ± SEM (n = 3 independent biological replicates). P value was determined by unpaired two-sided Student’s t test with no correction for multiple comparisons (b, e, i, k, n, p, q) and Kaplan-Meier method (c, f, l, o). Schematic diagrams (a, d, j, m) were created with BioRender.com. Source data are provided as a Source data file.

