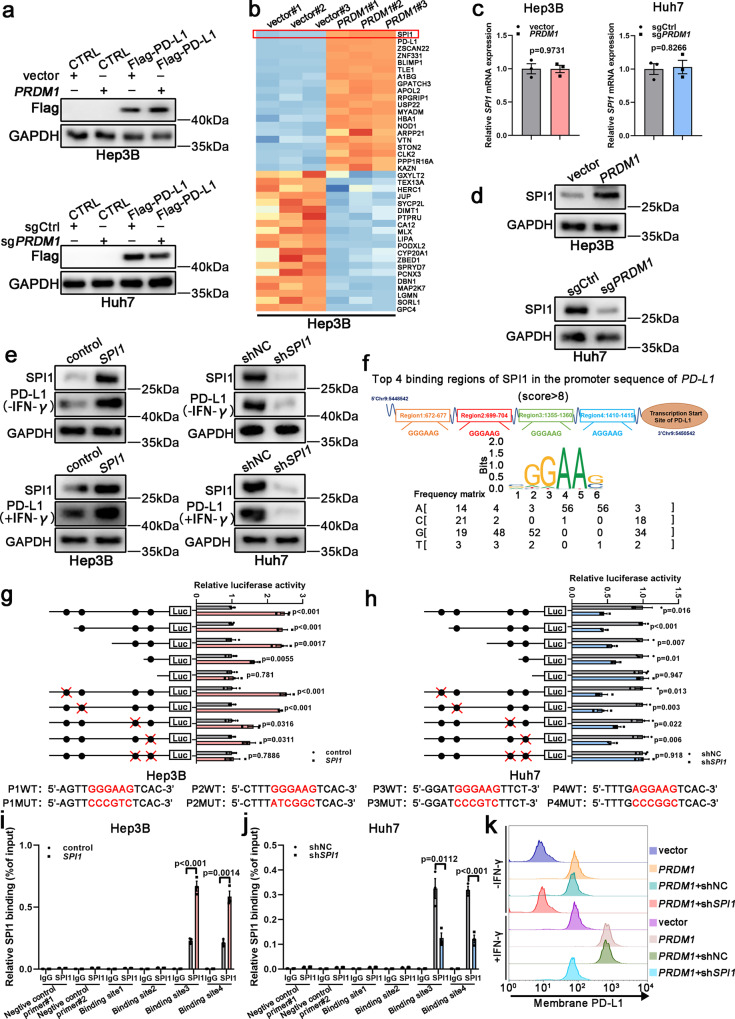
Fig. 3. SPI1 serves as a downstream effector of PRDM1 to enhance PD-L1 transcription.
a Western blotting of PD-L1/Flag levels in PRDM1-overexpressing and vector Hep3B cells or in PRDM1-knockout and sgCtrl Huh7 cells. n = 3 independent biological replicates. b TMT-based quantitative proteomic analysis of Hep3B cells stably overexpressing PRDM1 and the corresponding control cells, (PRDM1 and vector cells, respectively), with 3 replicates per group. Heat map showing the top 20 upregulated proteins and the top 20 downregulated proteins between PRDM1-overexpressing Hep3B cells and control cells in the proteomics analysis. c qRT-PCR of SPI1 expression in PRDM1-overexpressing and vector Hep3B cells or in PRDM1-knockout and sgCtrl Huh7 cells. Data presented as mean ± SEM (n = 3 independent biological replicates). d Western blotting of SPI1 expression in PRDM1-overexpressing and vector Hep3B cells or in PRDM1-knockout and sgCtrl Huh7 cells. n = 3 independent biological replicates. e Western blotting of PD-L1 expression in SPI1-overexpressing and control Hep3B cells or SPI1-knockdown and shNC Huh7 cells with or without IFN-γ treatment. n = 3 independent biological replicates. f Putative SPI1-binding sites (SBS) within the genomic sequence adjacent to the transcription start site (TSS) of the PD-L1 gene. g, h Luciferase activities of PD-L1 promoter reporter vectors in Hep3B (g) and Huh7 (h) cells. Red characters in the binding regions suggest the putative or mutated SPI1-binding sequences. Data presented as mean ± SEM (n = 3 independent biological replicates). i, j ChIP analysis of SPI1 binding to the PD-L1 promoter in Hep3B (i) and Huh7 (j) cells. Two promoter regions of PD-L1 not expected to be bound by SPI1 were employed as negative controls (negative control#1 and #2). Data presented as mean ± SEM (n = 3 independent biological replicates). k Flow cytometry analysis of PD-L1 expression in Hep3B cells with or without IFN-γ treatment. n = 3 independent biological replicates. P value was determined by unpaired two-sided Student’s t test (c, g, h, i, j). Source data are provided as a Source data file.

