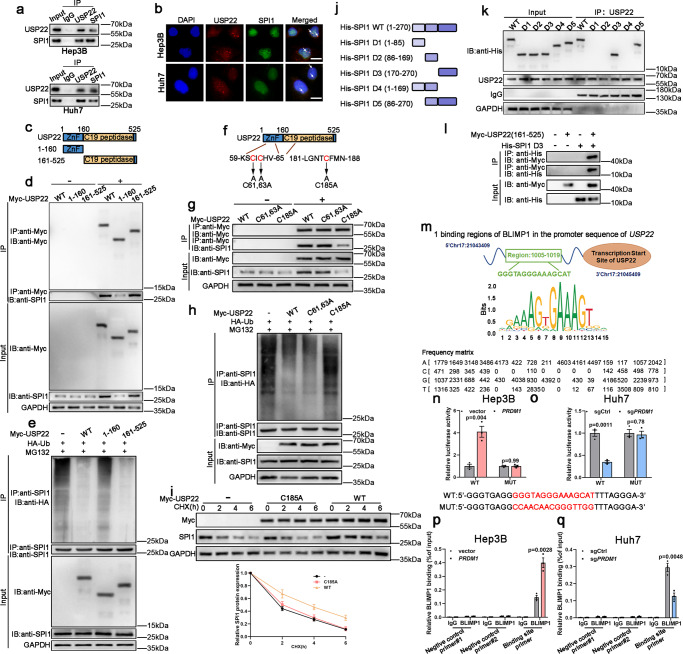
Fig. 5. USP22 was identified as a SPI1-interacting protein.
a Co-IP experiments indicated the interaction of endogenous USP22 and SPI1. n = 3 independent biological replicates. b Confocal microscopy showing colocalization of USP22 (red) with SPI1 (green). n = 3 independent biological replicates. Scale bars, 20 µm. c Schematic illustration of USP22 and its mutants. d USP22 and its mutants were immunoprecipitated and the bound SPI1 was determined. n = 3 independent biological replicates. e SPI1 ubiquitination was determined by SPI1 immunoprecipitation and western blotting using an anti-HA antibody. n = 3 independent biological replicates. f Schematic illustration of USP22 and its point mutants. g USP22 and its point mutants were immunoprecipitated and the bound SPI1 was determined. n = 3 independent biological replicates. h The effects of USP22 and its point mutants on SPI1 ubiquitination were confirmed. n = 3 independent biological replicates. i The protein levels of USP22 (Myc) and SPI1 were detected. Data presented as mean ± SEM (n = 3 independent biological replicates). j Schematic representation of full-length SPI1 and truncated SPI1. k Interactions between USP22 and full-length or truncated SPI1 were analyzed using co-IP in HEK-293T cells. n = 3 independent biological replicates. l Co-IP experiments indicated the interaction of Myc-USP22 (161-525) and His-SPI1 (D3) in HEK-293T cells. n = 3 independent biological replicates. m Putative BLIMP1-binding site (BBS) within the genomic sequence adjacent to TSS of USP22 gene. n, o Luciferase activities of USP22 promoter reporter vectors in Hep3B (n) and Huh7 (o) cells. Red characters in the binding regions suggest putative or mutated BLIMP1 binding sequences. Data presented as mean ± SEM (n = 3 independent biological replicates). p, q ChIP analysis of BLIMP1 binding to the USP22 promoter in Hep3B (p) and Huh7 (q) cells. Two promoter regions of USP22 not expected to be bound by BLIMP1 were employed as negative controls. Data presented as mean ± SEM (n = 3 independent biological replicates). P value was determined by unpaired two-sided Student’s t test (n, o, p, q). Source data are provided as a Source data file.

