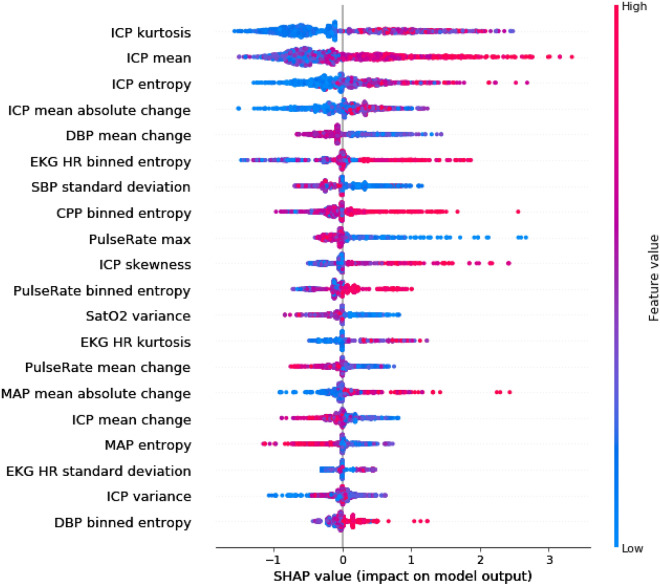
Figure 4.
Average SHAP value plot, which assesses feature importance. Displayed in descending order of importance are the 20 features which were most contributory to the XGB model bundle performance with the 30-min prediction horizon, along with averaged SHAP values. For instance, low values (blue) of ICP kurtosis favor a prediction of “control” (negative SHAP values), whereas high values (red) of ICP mean favor a prediction of “event” (positive SHAP values).

