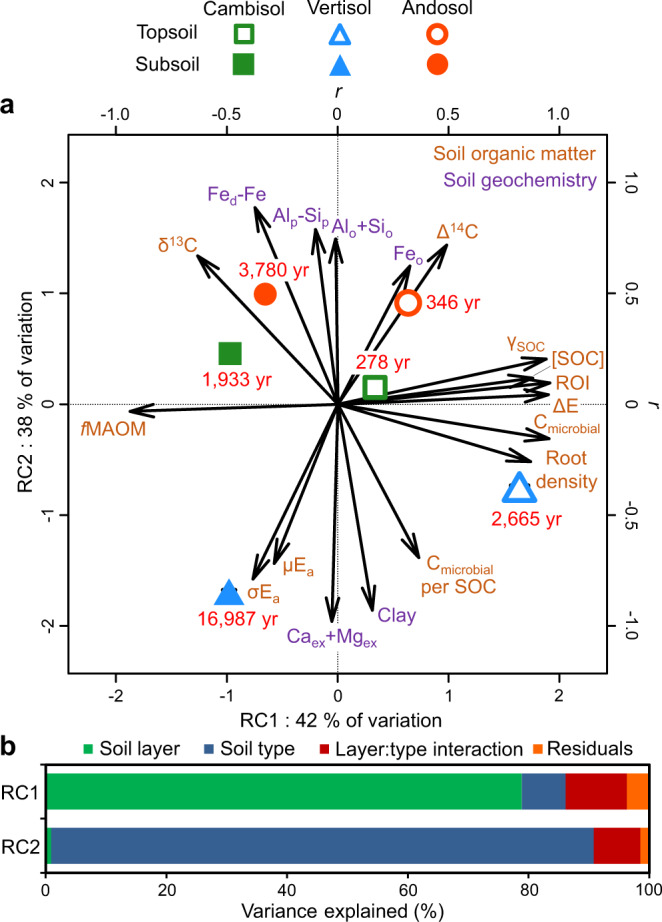
Fig. 1. Variation in soil biogeochemical properties among soil types and layers.

a ordination by rotated principal component analysis (n = 24 soil cores). Arrows indicate correlations between soil properties and rotated component (RC) axes. Large symbols with error bars show treatment means ± standard errors. The numbers in red indicate the turnover time of soil organic carbon (SOC) based on radiocarbon signature for each treatment. The subscripts ex, d, o, and p indicate exchangeable, dithionite, oxalate, and pyrophosphate extracts, respectively. See Table 1 for other abbreviations. b variance partitioning of RC axis values across experimental factors.
