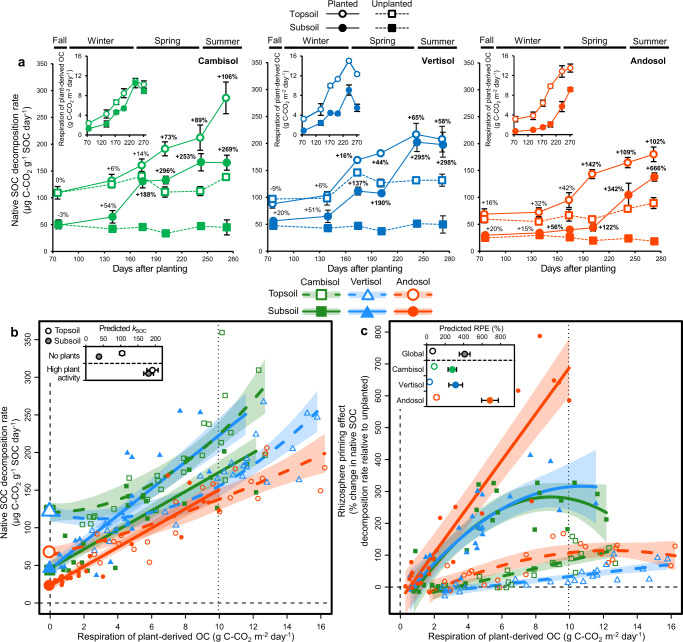
Fig. 3. Root effects on the decomposition of native soil organic carbon (SOC) across time.
a Temporal variation in native SOC decomposition rate (kSOC) and respiration of plant-derived organic carbon (OC, insets) at the microcosm scale in the first series of incubations (n = 288 microcosm incubations). The respiration of plant-derived OC includes both plant autotrophic respiration and soil microbial heterotrophic respiration derived from rhizodeposits. Symbols with error bars show treatment means ± standard errors (n = 4 replicate microcosms). Numbers above the symbols represent rhizosphere priming effects (RPEs, in % change in kSOC for planted soils relative to the unplanted control). Significant RPEs are in bold (two-sided t-test). b, c Response of native SOC decomposition rate (b, kSOC, n = 288 microcosm incubations) and rhizosphere priming effect (c, RPE, n = 144 planted microcosm incubations) to the variation in respiration of plant-derived OC across time in the first incubation series. Symbols with error bars along the vertical dashed line in (b) show treatment means ± standard errors of unplanted controls (n = 24 microcosm incubations). Polygons around regression lines represent 95% confidence intervals. The inset in (b) show kSOC values averaged across soil types in the absence of roots and at high level of plant activity as predicted for a common high value of the predictor shown by the vertical dotted line. The insets in (c) show predicted RPE values across treatments at high level of plant activity. Statistical results are shown in Supplementary Table 3.

