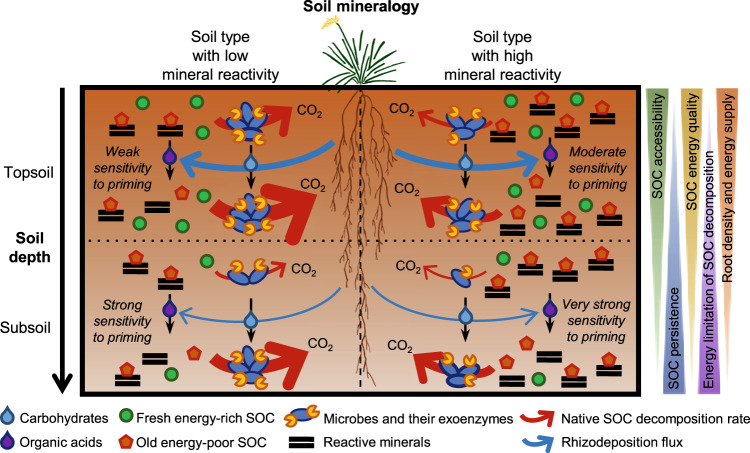
Fig. 6. Conceptual model illustrating the bioenergetic control of SOC dynamics and its sensitivity to rhizosphere priming across soil depth and mineral reactivity contexts.
The width of native SOC decomposition arrows is proportional to its rate. The rhizosphere priming intensity represents the magnitude in the acceleration of native SOC decomposition induced by a given density and energy supply of plant roots. Plant image by Alice Trotel.

