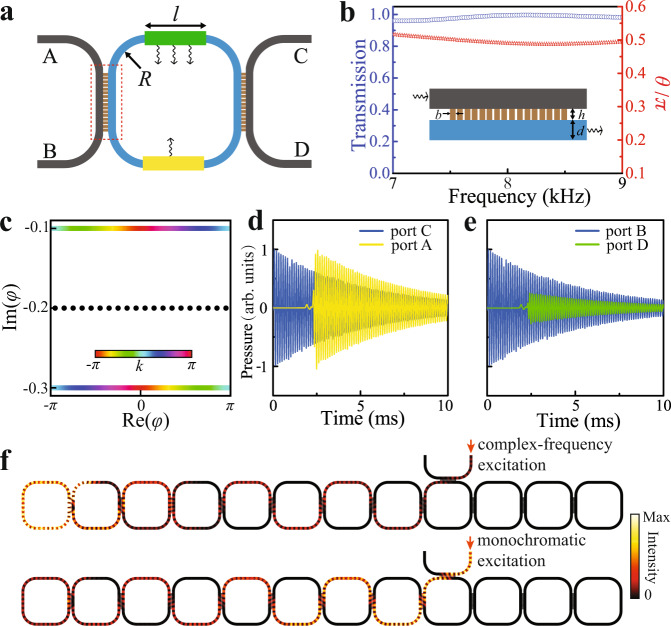
Fig. 3. Numerical results for the acoustic ring resonator lattice.
a The acoustic unit cell. The radius, R, of the circular part is 5.6 cm and the width, l, of the straight part is 9.6 cm. The green and yellow areas with arrows represent areas with different losses. The red dashed boxes denote the coupling regions. b Plots of θ (red stars) and the transmission coefficient (blue circles) between two neighboring rings against frequency. The inset shows the simulation geometry, which consists of an array of narrow waveguides (16 in total) that are used to couple the neighboring rings. The width and thickness of each narrow tube h = 0.7 cm and b = 0.35 cm, arrayed with a period of 0.47 cm. The width, d, of the ring resonator is 1.4 cm. c The eigen spectra for the PBC and OBC lattices are derived from the transfer matrix method with θ = 0.5π. The colored dots and black dots denote the results for the PBC lattice and OBC lattice, respectively. d, e Simulated pressure profiles of the input and output signals with complex frequency for the waves propagate along a path with (d) less loss and (e) more loss, respectively. The transient simulations are conducted by finite element method. f Simulated field distributions at 15 ms after the lattice is injected with monochromatic excitation and complex-frequency excitation, respectively.

