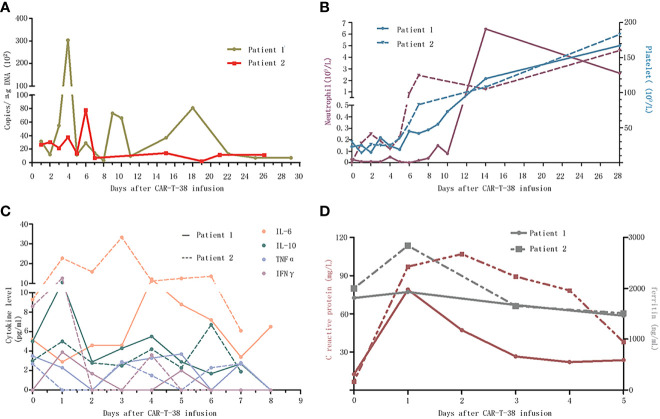
Figure 2.
Dynamic changes after CAR-T-38 treatment. (A) The copies of CAR-T-38 cells in the peripheral blood measured by qPCR as the number of copies of lentiviral vector sequence per microgram of genomic DNA, which reached peak levels on days 4 and 6, respectively. (B) The neutrophil counts (left Y-axis) in patients 1 and 2 rose above 0.5 × 10⁹ on days 14 and 7, respectively, and platelet counts (right Y-axis) of the two patients rose above 100 × 109 on day 14. (C) This part showed the changes of cytokines including IL-6, IL-10, TNFα, and IFNγ concentrations after CAR-T-38 infusion. (D) This part showed the changes of c-reaction protein (left Y-axis) and ferritin (right Y-axis) concentrations after CAR-T-38 infusion.

