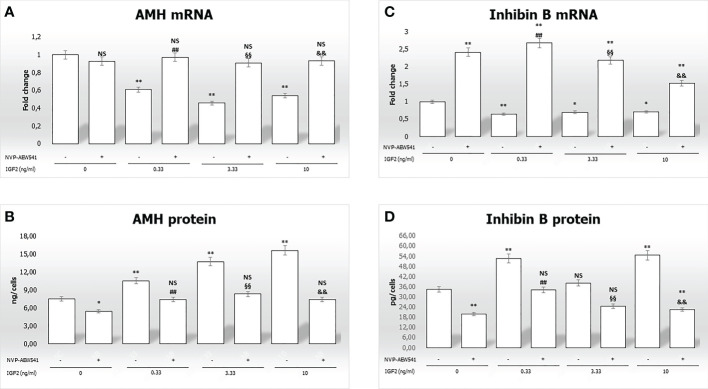
Figure 4.
Anti-Müllerian hormone (AMH) and inhibin B gene expression and protein secretion. AMH mRNA and protein levels are shown in panels (A, B), respectively. Inhibin B mRNA and protein levels are shown in panels (C, D), respectively. Data represent the mean ± SD of three independent experiments, each performed in triplicate. Non-significant (NS) vs SCs, *p < 0.05 and **p < 0.001 vs SCs, ##p < 0.001 vs 0.33 ng/ml of rhIGF2, §§p < 0.001 vs 3.33 ng/ml, and &&p < 0.001 vs 10 ng/ml of rhIGF2.

