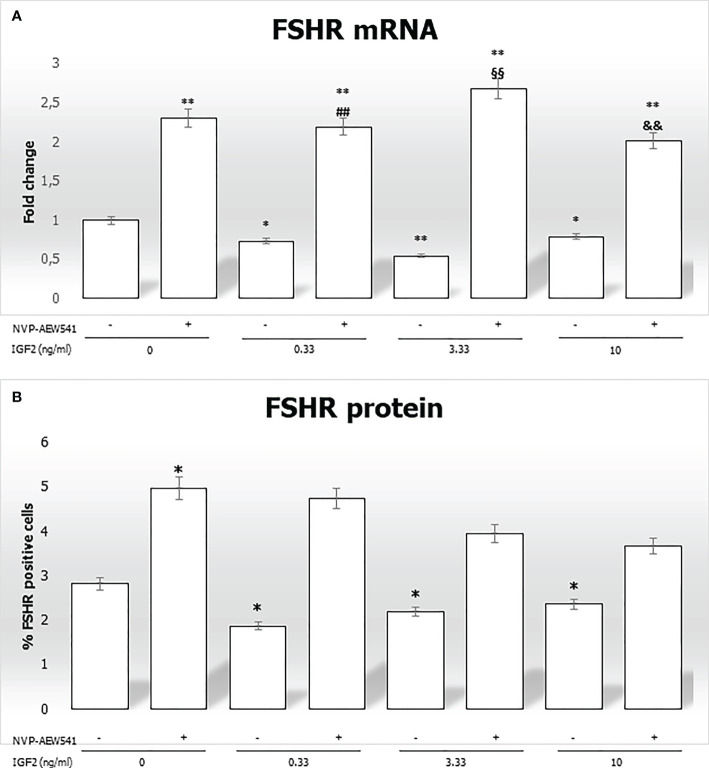
Figure 5.
FSHR gene and protein expression in Sertoli cells (SCs). (A) RT-PCR analysis of the FSHR gene. Data represent the mean ± SD of three independent Q3 experiments, each performed in triplicate. (B) Cytofluorimetric analysis. The bars represent the percentage of FSHR-positive cells without stimulation, after incubation with NVP-AEW541, IGF2, or NVP-AEW541 + IGF2. Compared with the control, the percentage of FSHR-positive cells was significantly reduced after incubation with IGF2 (2.82 ± 0.1% in the untreated controls, 1.87 ± 0.1% at 0.33 ng/mL, 2.19 ± 0.2% at 3.33 ng/mL, 2.36 ± 0.1% at 10 ng/mL; p < 0.01). The suppression was reversed after incubation with NVP- AEW541. Data represent the mean ± SD of three independent experiments, each performed in triplicate. FSHR, follicle-stimulating hormone receptor; IGF2, Insulin-like growth factor 2. *p < 0.05 and **p < 0.001 vs SCs, ##p < 0.001 vs 0.33 ng/ml of rhIGF2, §§p < 0.001 vs 3.33 ng/ml, &&p < 0.001 vs 10 ng/ml of rhIGF2”

