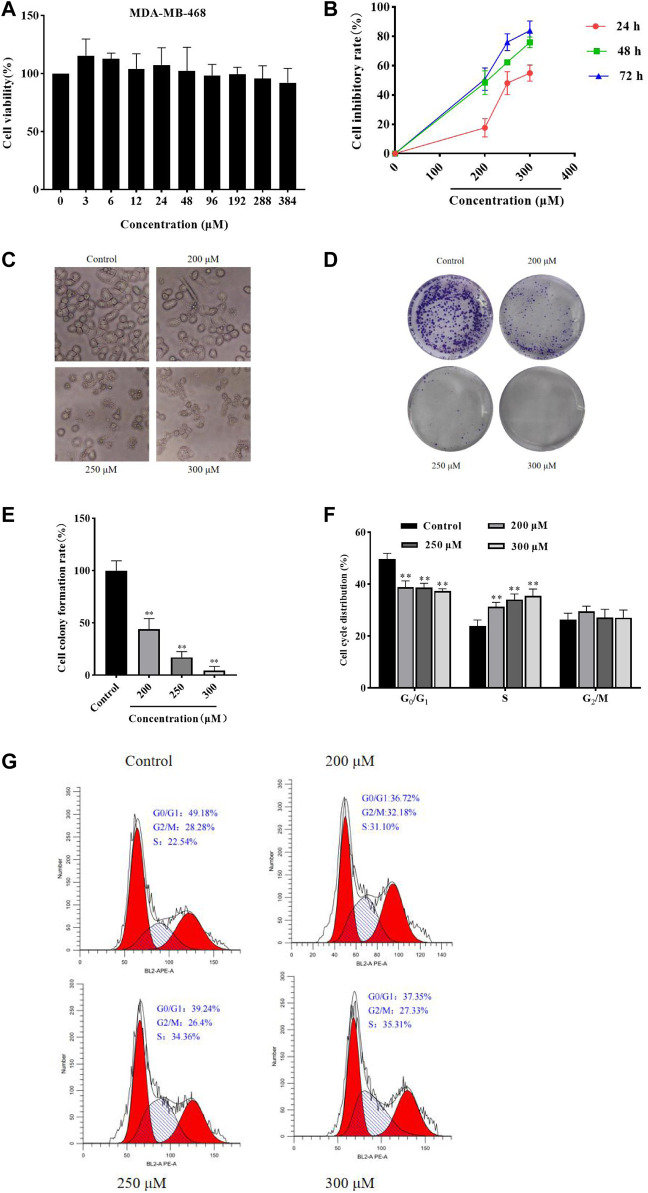
FIGURE 1.
GA inhibited HCC1806 cells viability and affected cells morphology, and affected HCC1806 cells proliferation and cycle distribution. (A) The MDA-MB-468 cells viability was detected by MTT assay. (B)The HCC1806 cell inhibitory rate was detected by MTT assay. (C) The morphology changes of HCC1806 cells treated with different concentrations of GA were observed under an inverted microscope. (D,E) Effect of GA on the colony formation rate of HCC1806 cells. (F,G) The cell cycle distribution of HCC1806 were assessed by flow cytometry. Date were expressed as means ± SD. Compared with the control group, ** p < 0.01.

