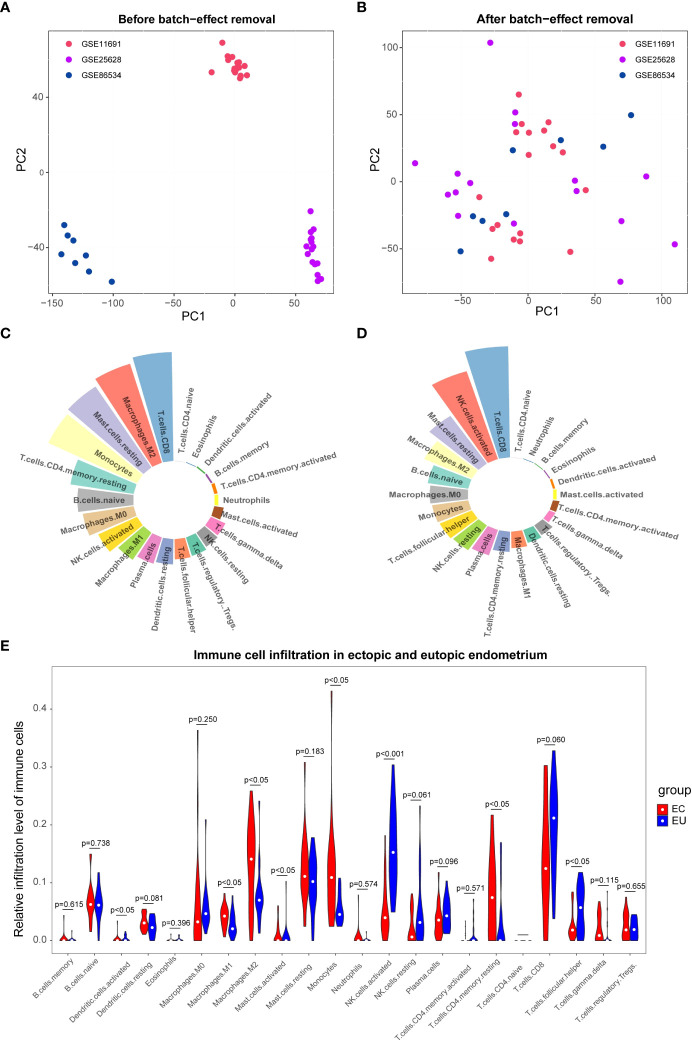
Figure 1.
The immune infiltration cell analysis between eutopic endometrium (EU ) and ectopic endometrium(EC). (A, B) Principal component analysis (PCA) of the GSE11691, GSE25628, and GSE86534 dataset. The points of the scatter diagrams diaplay the samples based on the top two principal components (PC1 and PC2) of gene expression profiles without (A) and with (B) the removal of batch effect .The dots in the graph represent samples, and the colors represent corresponding samples different datasets. (C, D) Proportion of immune cell infiltration in EU (C) and EC (D) samples. The different colors represent different immune cells and the size of the loop represents the proportion of immune cells. (E) Differences between EU and EC samples for 22 infiltration immune cells. Red represents endometriosis sample (EC), blue represents endometrial eutopic sample (EU).

