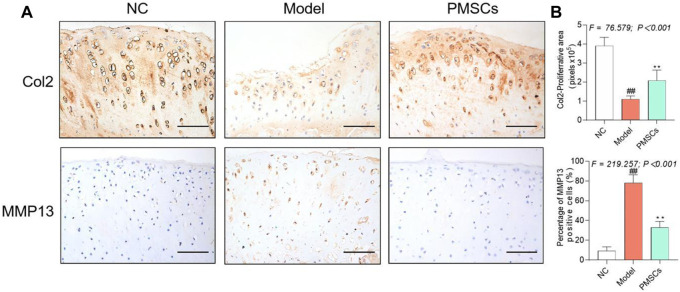
FIGURE 3.
IHC evaluation of the in vivo effect of PMSCs on anabolism/catabolism. (A) IHC staining of Col2 and MMP13 on cartilage; Scale bars = 50 μm. (B) Quantitative measurement of positive area percentage of Col2 and positive cell percentages of MMP13. Values were presented as mean ± SD. ## p < 0.01 vs. NC group; *p < 0.05 and **p < 0.01 vs. Model group. 10 rats from each group were used per each analysis and all experiments were repeated at least three times.

