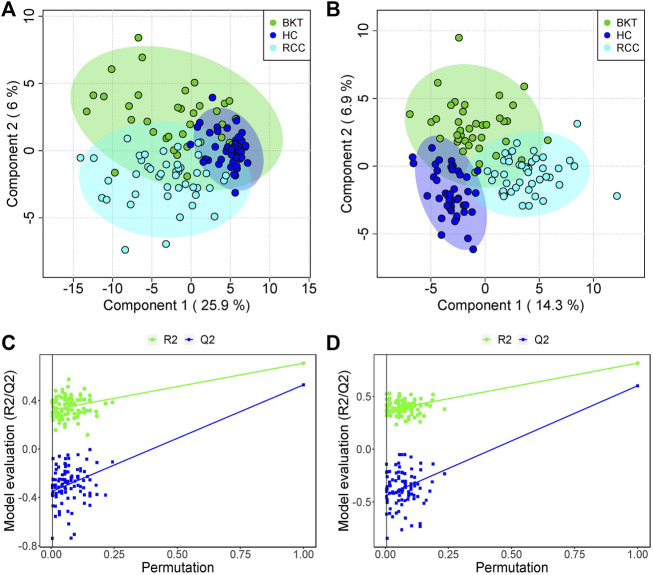
FIGURE 3.
PLS-DA analysis and permutation test. PCA scores for the HC, BKT, and RCC groups in the ESI + model (A) and ESI- model (B) Permutation test in the ESI + model (C) and ESI- model (D) among HC group, BKT group, and RCC group. The criterion for PLS-DA not overfitting is that the R2 and Q2 values of all alignments on the left side are lower than the corresponding original points on the right side. The regression line of point Q2 intersects the horizontal coordinates or is less than 0. R2X and R2Y denote the degree of explanation of the PLS-DA model for the categorical variables X and Y, respectively. Q2 denotes the predictiveness of the PLS-DA model. HC, healthy control; BKT, benign kidney tumor; RCC, renal cell carcinoma.

