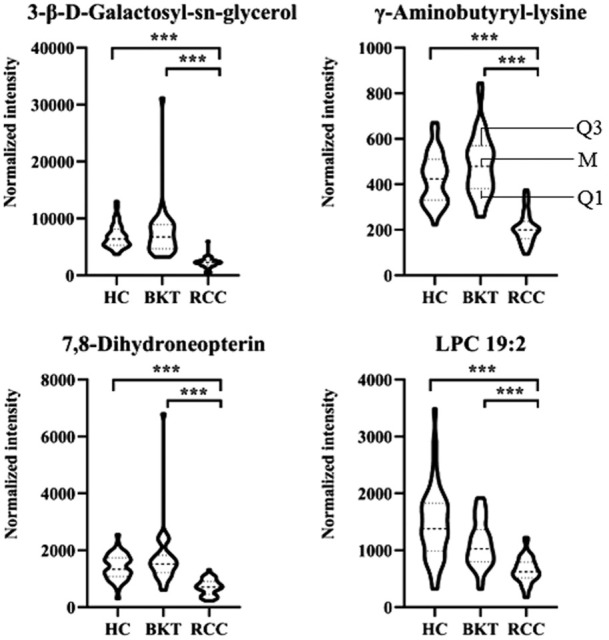
FIGURE 6.

Normalized peak intensities of the four candidate biomarkers. HC, healthy control; BKT, benign kidney tumor; RCC, renal cell carcinoma. LPC, lysophosphatidylcholine. Normalization of peak intensities is performed using the MetNormalizer method of QC-based support vector regression analysis. QC, an aliquot mixture of all serum samples processed in the same way as the samples. Q1, 25th percentile; M, median; Q3, 75th percentile. ***p < 0.001.
