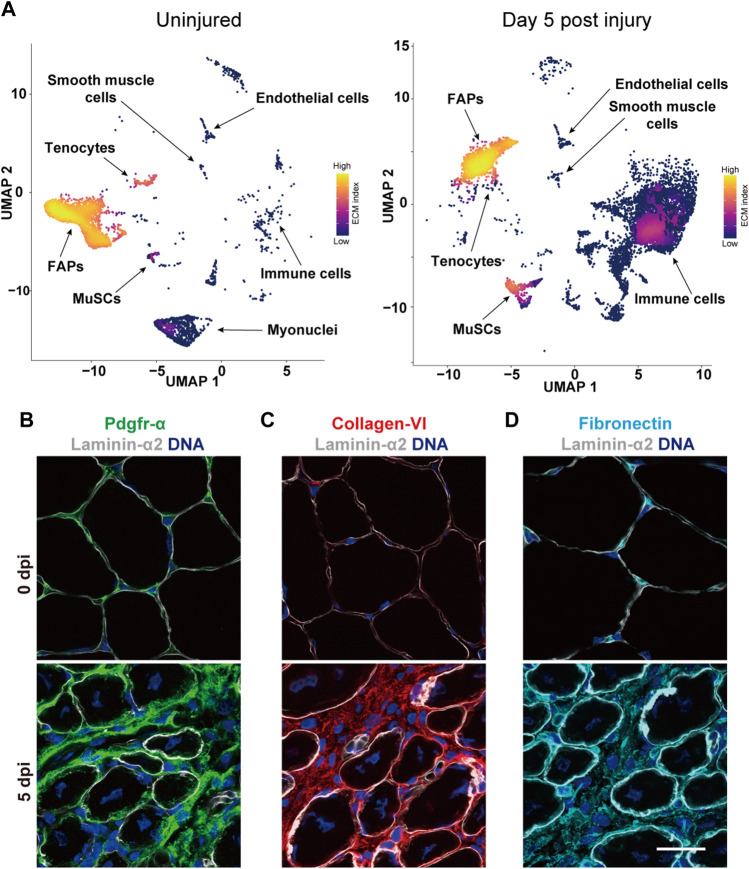
FIGURE 6.
The MuSC niche in regenerating skeletal muscle. (A) The images show the joint gene expression density (Alquicira-Hernandez and Powell, 2021) of an index of ∼100 ECM genes obtained from the Matrisome database (Shao et al., 2020) in the UMAP projection (McInnes et al., 2018) of single cell RNA-sequencing data (Oprescu et al., 2020) deposited in the Gene Expression Omnibus (GEO) database (Barrett et al., 2013) from uninjured and regenerating mouse skeletal muscle at 5 days post injury. FAPs is short for fibro–adipogenic progenitors. (B) Immunostaining of mouse skeletal muscle cross sections under uninjured conditions (0 dpi) or 5 days post injury (5 dpi) visualizing FAPs based on Pdgfrα (green) co-stained with laminin α2 (white) and DNA (blue). (C,D) Immunostaining of mouse skeletal muscle cross sections at 0 or 5 dpi showing collagen IV (red), fibronectin (turquoise), laminin α2 (white) and DNA (blue). Scale bar = 20 µm.

