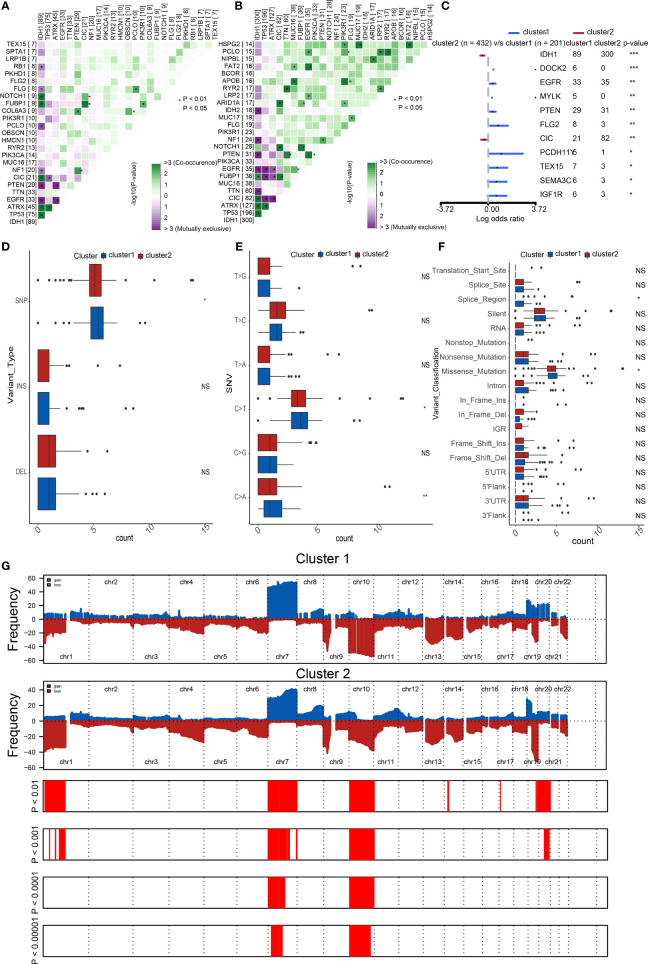
Figure 3.
Distinct genomic profiles of the two clusters. The co-occurrence or mutual exclusivity of the top 25 most mutated genes in (A) cluster1 and (B) cluster2. *p < 0.01, `p < 0.05. (C) Demonstration of the 11 most altered genes between the clusters by the forest plot. Frequency comparison according to (D) variant type, (E) SNV, and (F) variant classification between the two clusters. (G) Amplifications and deletions in two clusters of SOX family by GISTIC 2.0. ***p < 0.001, **p < 0.01, *p < 0.05, NS, no significance.

