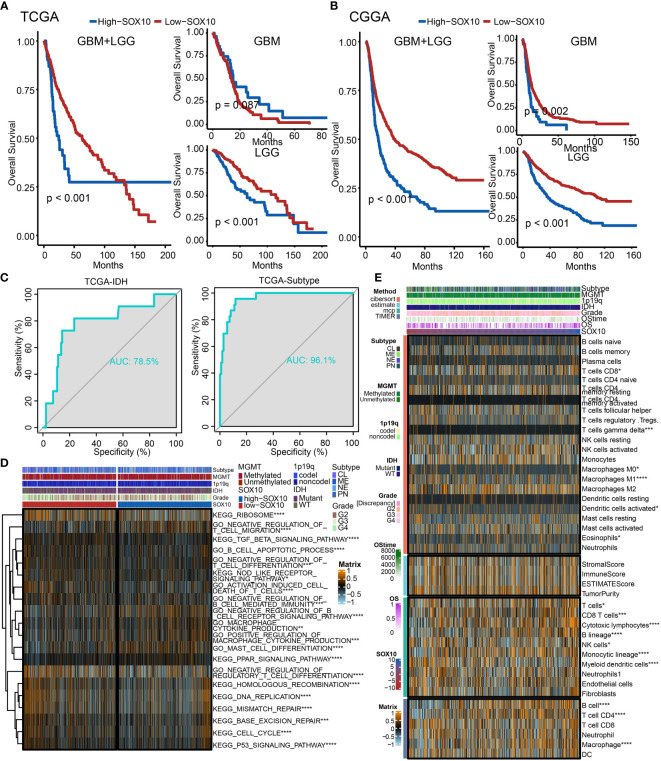
Figure 5.
The prognostic potential of SOX10. Kaplan–Meier overall survival analysis of SOX10 in GBM, LGG, and pan-glioma based upon the (A) TCGA and (B) CGGA datasets. (C) Predictive value of SOX10, IDH, and subtype measured by ROC curves in TCGA dataset. (D) The heatmap for gene set variation analysis of SOX10 from TCGA. *p < 0.05, **p < 0.01, ***p < 0.001, ****p < 0.0001. (E) Heatmap visualized the abundance of infiltrating immune cell groups with divergent SOX10 degree. *p < 0.05, **p < 0.01, ***p < 0.001, ****p < 0.0001.

