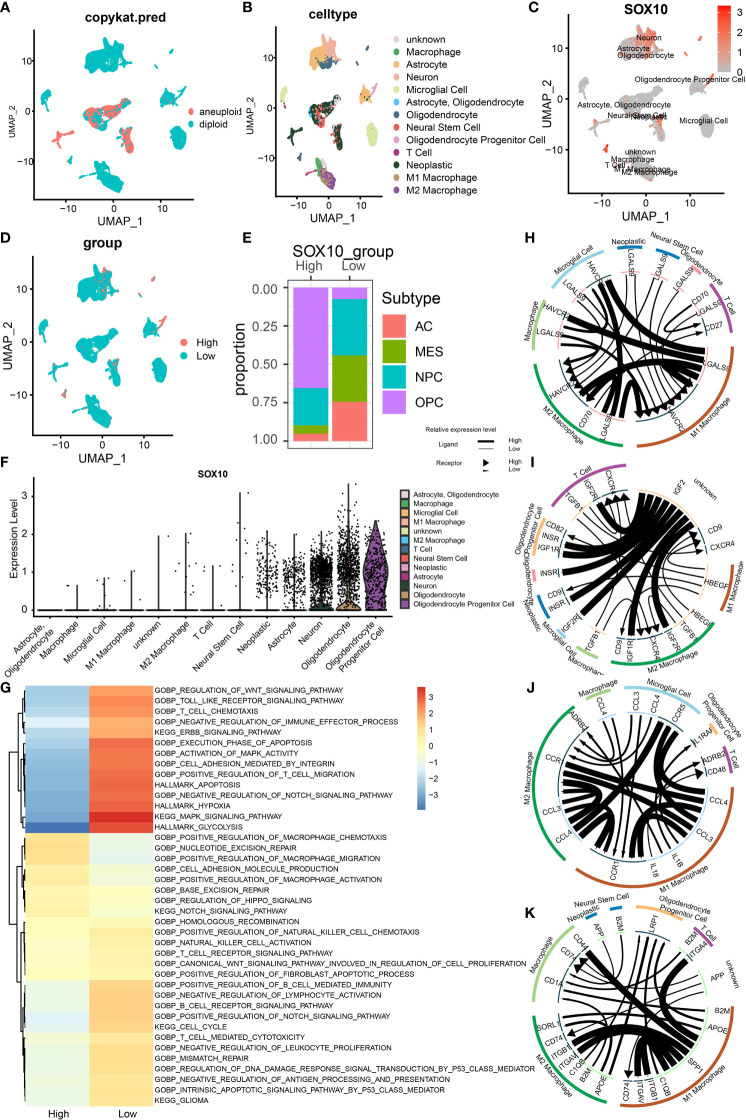
Figure 7.
Stratification, identification, and SOX10 co-expression on glioma cells by single-cell sequencing analysis. (A) UMAP projection determined by CopyKat analysis. (B) UMAP projections of different cells, color-coded by cell types. (C) Annotation of different cell types and the expression of SOX10 in each cell type. (D) UMAP projections of two cell groups based on the expression of SOX10. (E) The proportion of glioma subtypes in the high and low SOX10 expression group. Astrocytes (AC), neural progenitor cells (NPC), mesenchyme (MES), and oligodendrocyte precursor cells (OPC). (F) Violin plot of SOX10 expression distribution of divergent cell clusters. (G) Enrichment analysis correlating divergent immune regulatory processes with high and low SOX10 expressions. (H) Correlation circles for positively and negatively correlated checkpoint genes in the high expression group of SOX10. (I) Correlation circles for positively and negatively correlated growth factors in the high expression group of SOX10. (J) Correlation circles for positively and negatively correlated cytokines in the high expression group of SOX10. (K) Correlation circles for positively and negatively correlated other genes in the high expression group of SOX10.

