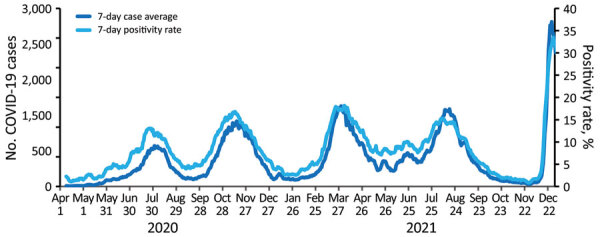
Figure 1.

Average number of laboratory-confirmed COVID-19 cases and SARS-CoV-2 positivity rates in Kenya from April 1, 2020, through December 26, 2021, in a review of longstanding public health collaborations between the government of Kenya and CDC Kenya in response to the COVID-19 pandemic. The US Centers for Disease Control and Prevention in Kenya supports the Kenya Ministry of Health with COVID-19 data analysis and visualization. By December 26, 2021, Kenya had experienced 5 epidemic waves during July and November in 2020 and March, August, and December in 2021; a total of 282,554 laboratory-confirmed COVID-19 cases, 5,361 related deaths, and a case fatality rate of 1.9% were reported. The graph shows the 7-day averages for the number of COVID-19 cases and positivity rates.
