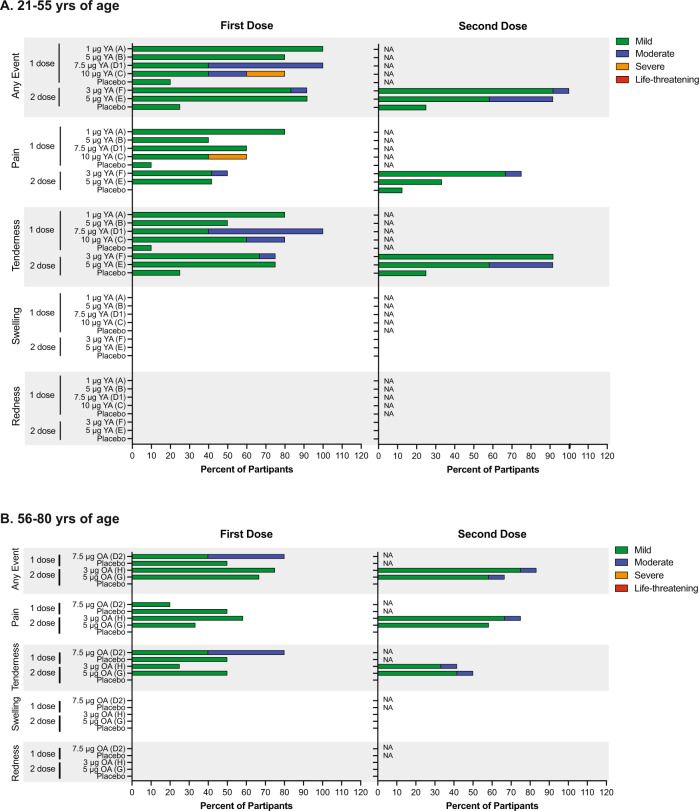
Fig. 2. Local solicited adverse events.
Shown are the percentages of vaccinated participants reporting local solicited events. Data are represented for age groups, 21–55 years (A) and 56–80 years (B). Severity of local solicited Events are displayed as mild (green), moderate (blue), severe (orange), or life-threatening (red). *Note, injection-site swelling and injection-site redness were not reported. YA younger adults (21–55), OA older adults (56–80).

