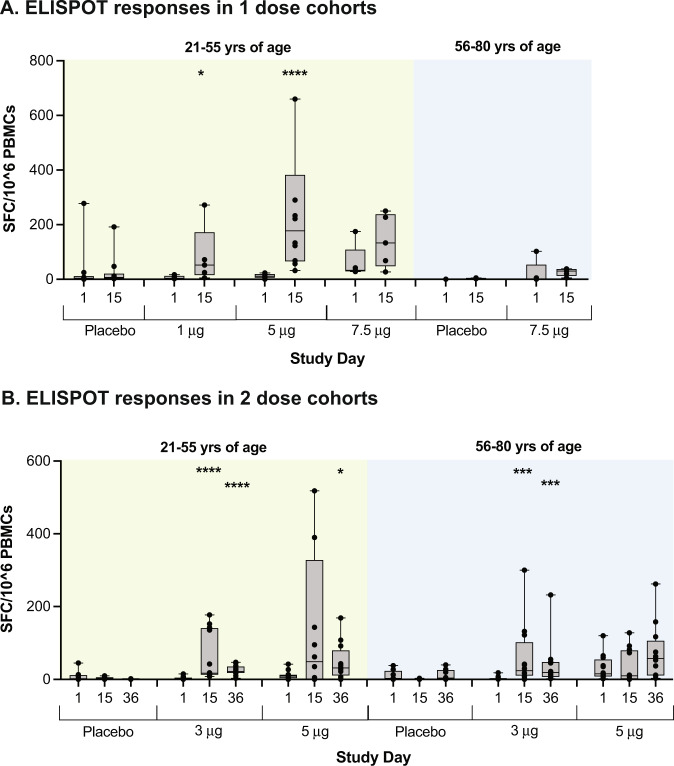
Fig. 5. SARS-CoV-2 specific T-cell responses to ARCT-021.
T-cell responses were measured using an interferon gamma (IFNγ) enzyme-linked immune absorbent spot (ELISPOT) assay and represented as spot-forming cells (SFC) per million PBMCs (A and B). Displayed are cumulative ELISPOT results for four peptide pools spanning the SARS-CoV-2 Spike. The data are represented as box and whisker plots where the middle horizontal line marks the median. Each dot represents an individual participant. Within each cohort, antibody data from each timepoint were compared to baseline (i.e., day 1) using Mann–Whitney U test (P-values marked with *0.01 < P < 0.05, **0.001 < P < 0.01, ***0.001 < P < 0.01, ****P < 0.0001).

