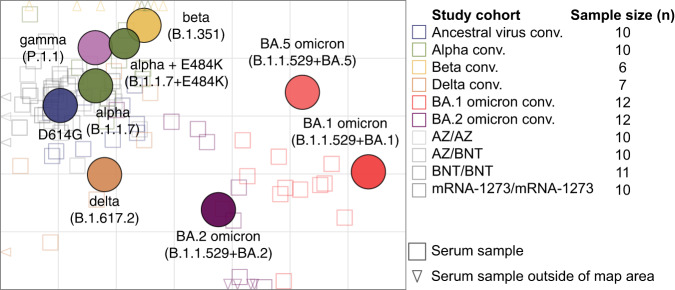
Fig. 3. Antigenic map of SARS-CoV-2 variants constructed from single exposure convalescent and double vaccinated sera.
Virus variants are shown as colored circles, sera as open squares with the color corresponding to the infecting variant. Triangles indicate sera positioned outside the central map area and point in the direction where the corresponding serum is positioned. Vaccine sera are shown in grey tones (from dark to light: mRNA-1273/mRNA-1273 n = 10, BNT162b2/BNT162b2 (BNT/BNT) n = 11, ChAdOx-S1/BNT162b2 (AZ/BNT) n = 10, ChAdOx-S1/ChAdOx-S1 (AZ/AZ) n = 10). The alpha + E484K variant is shown as smaller circle due to its additional substitution compared to the alpha variant. The x- and y-axis represent antigenic distances with one grid square corresponding to one two-fold serum dilution of the neutralization titer. The map orientation within x- and y-axis is free as only relative distances can be inferred. A non-zoomed in version of the map is shown in Figure S2. Only single-variant exposure sera have been used for construction of the map. n = 2 beta convalescent and n = 6 BA.1 convalescent samples could not be positioned in the map because of too many <LOD titers. The table in the right part indicates how many sera from each group were positioned on the map (Ancestral virus conv. n = 10, Alpha conv. n = 10, Beta conv. n = 6, Delta conv. n = 7, BA.1 omicron conv. n = 12, BA.2 omicron conv. n = 12). Each of these serum samples has been titrated against D614G, alpha, alpha E484K, beta, gamma, delta, BA.1 omicron, BA.2 omicron, and BA.5 omicron variants. Neutralizing antibody titers are shown in Fig. 1 or have been published previously in1,2.

